Abstract
Understanding the spatial gene expression and regulation in the heart is key to uncovering its developmental and physiological processes, during homeostasis and disease. Numerous techniques exist to gain gene expression and regulation information in organs such as the heart, but few utilize intuitive true-to-life three-dimensional representations to analyze and visualise results. Here we combined transcriptomics with 3D-modelling to interrogate spatial gene expression in the mammalian heart. For this, we microdissected and sequenced transcriptome-wide 18 anatomical sections of the adult mouse heart. Our study has unveiled known and novel genes that display complex spatial expression in the heart sub-compartments. We have also created 3D-cardiomics, an interface for spatial transcriptome analysis and visualization that allows the easy exploration of these data in a 3D model of the heart. 3D-cardiomics is accessible here .
Go to the Article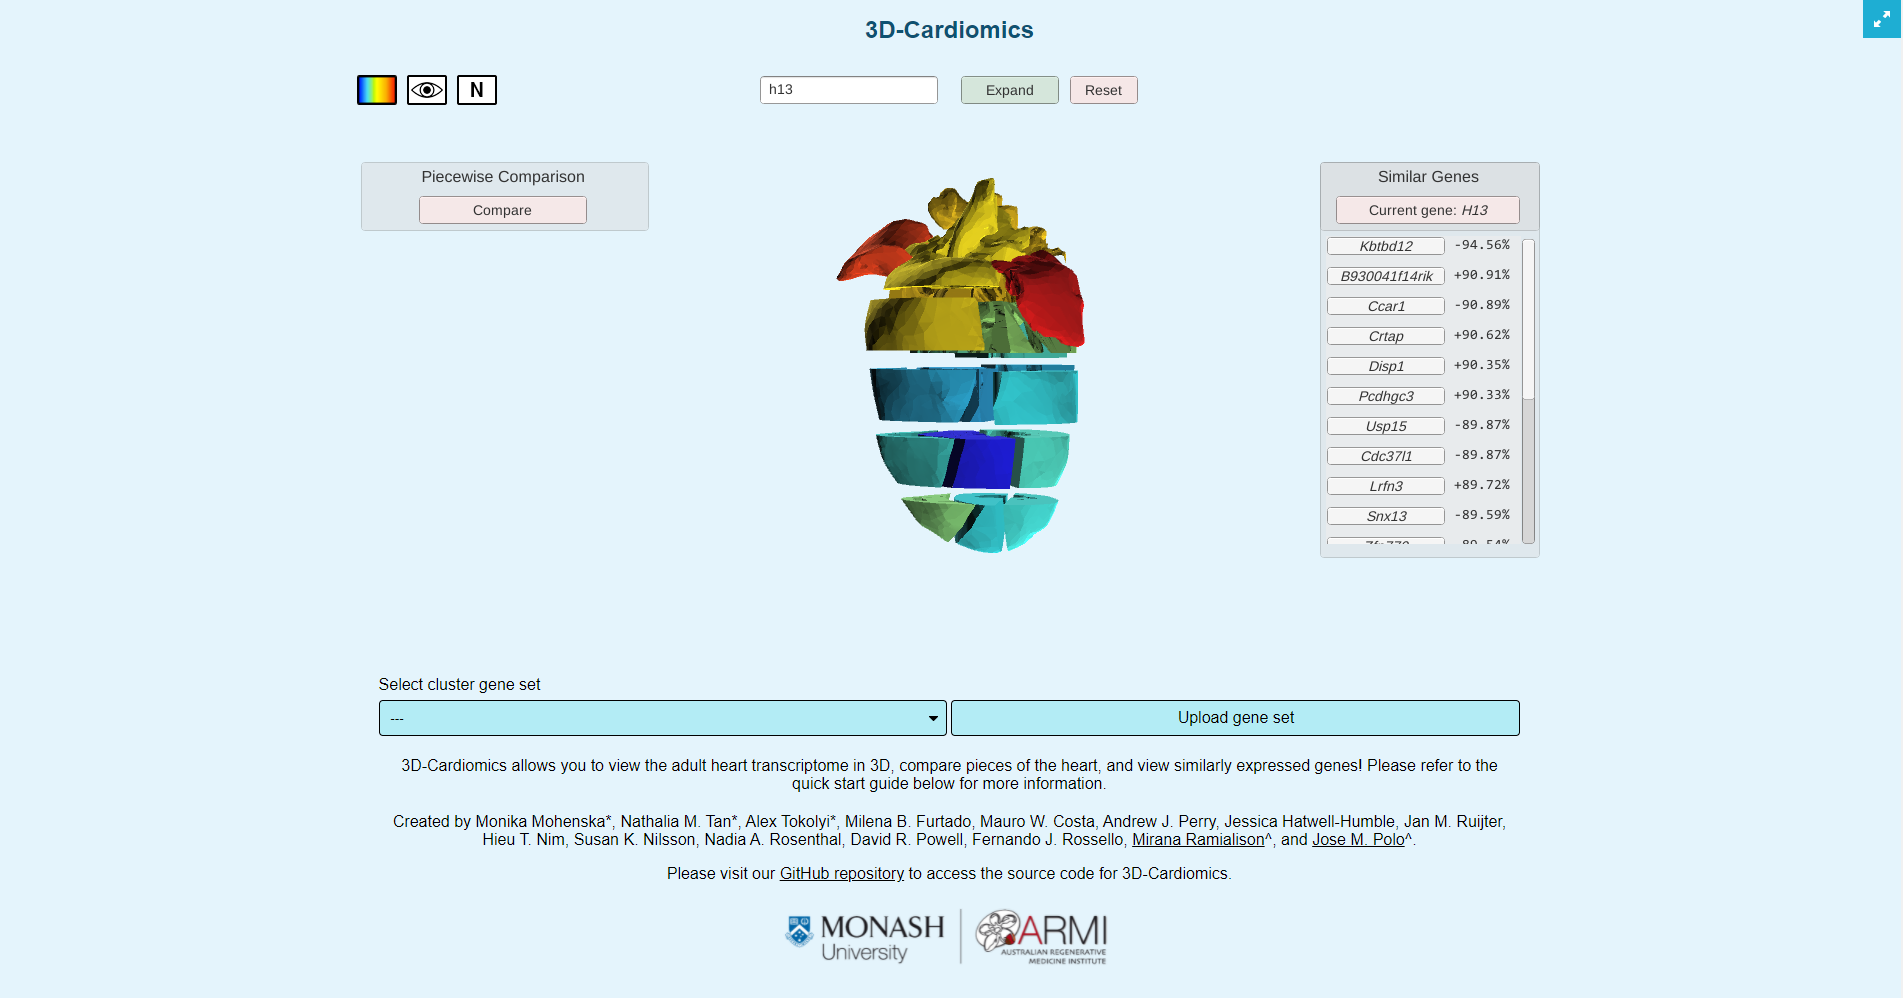
Documentation
3D-Cardiomics
A visual system for the exploration of cardiac transcriptome data
Overview
3D-Cardiomics provides a framework to map multi dimensional data (such as intensity and location of gene expression) on to 3D models in a heatmap-like manner. In our use case the intensity is the level of gene expression of those expressed in the adult heart, and the location is this expression level in 18 discrete pieces of the heart as measured by RNA-seq.
VR-cardiomics for VR devices such as Oculus Quest or Rift and for zSpace are available as well.
Dependencies
- Unity (we are using 2018.4.23.f1)
- Any modern web browser which is WebGL capable
Instructions
Simply run unity and open the root folder of the project. If the heart scene is not visible, open it in unity by browsing to and double clicking the following file:
Assets/3DCardiomics_main.unity
Upload expression values
3D-cardiomics supports to render user provided expression values on our 3D-cardiomics model on your local machine. Therefore, please follow the Instructions to run 3D-Cardiomics on your local machine.
To expression values are stored in:
Assets/Ressources/...
You can simply add new files by navigating to the Ressources folder (blue box) and using left-click to choose *Import New Asset....

Search the file to upload on your local computer and select it. To set this file as expression values click on the ScriptHolder Object (red box) on the left side.

This will open the Inspector Tab on the right side. Enter the name of the file you just uploaded into the input field Csv Filename Base (red box). (Without file ending such as .txt or .csv).

If you run the application now by pressing the Start button, your expression values will be available to display onto the 3D model.
Please keep in mind, that in order to use your expression values, the data has to be in a specific format. Currently supported are only CSV files, either in .csv or .txt format. Each row has to begin with the item's name and its intensity in the 18 locations. A sample file (fake_mouse_expression_values) is provided with a few randomised values to demonstrate the functionality.
The application only supports visualisation of raw data [A] for intensity if they are within a range from -3 to 20. The application will disable the raw view if values outside the boundaries are detected (Normalized expressions can still be viewed).
Address
Murdoch Children's Research Institute, Parkville, Melbourne
denis.bienroth@mcri.edu.au