Abstract
Spatially resolved transcriptomics is an emerging class of Low-throughput technologies that enable biologists to systematically investigate spatiotemporal gene expression patterns.
Upon data acquisition, one major hurdle is the subsequent interpretation and visualization of the datasets acquired. To address this challenge, we present a novel data visualization system with interactive functionalities in virtual reality, using an embedded automated workflow for analysis and data processing. The application is designed to help biologists to analyse and interpret spatially resolved transcriptomic datasets. Supported are various technologies such as Visium and Xenium by 10X Genomics, STOmics by BGI, MERFISH by VIZGEN or Tomo-seq. The system is implemented as a local 2D desktop application or as an immersive environment using head-mounted display virtual reality. This allows biologists to interact with the data in novel ways not previously possible, which includes visually exploring the gene expression patterns of an organ and comparing genes based on their 3D expression profiles.
Download VR-Omics v1.0
Documentation
Automated Workflow
Quick Access Visualisation Features
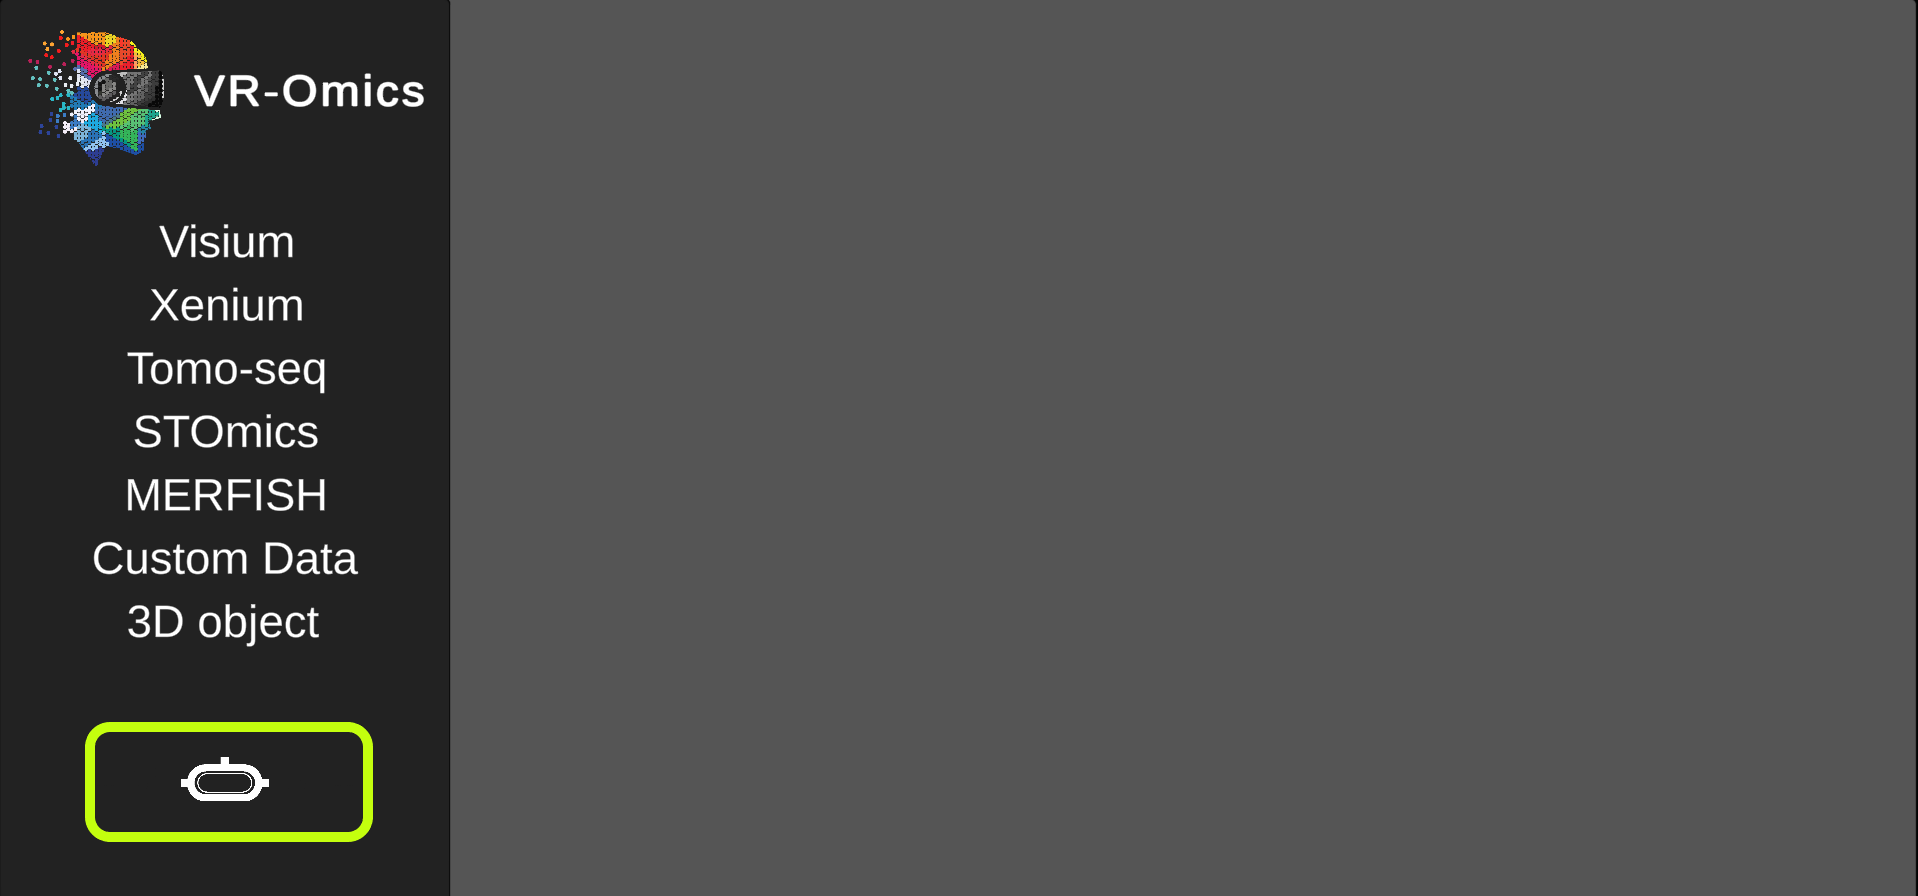
VR-Omics Setup
| 1 | Download VR-Omics |
Click the |
Download VR-Omics v1.0 |
|---|---|---|---|
| 2 | Download VR-Omics |
Click the |
|
| 3 | Unzip the folder |
To unzip the folder, right-click on the zip file and select |
|
| 4 | Start VR-Omics |
Once the folder is unzipped, open it and click on the |
|
VR-Omics Automated Workflow
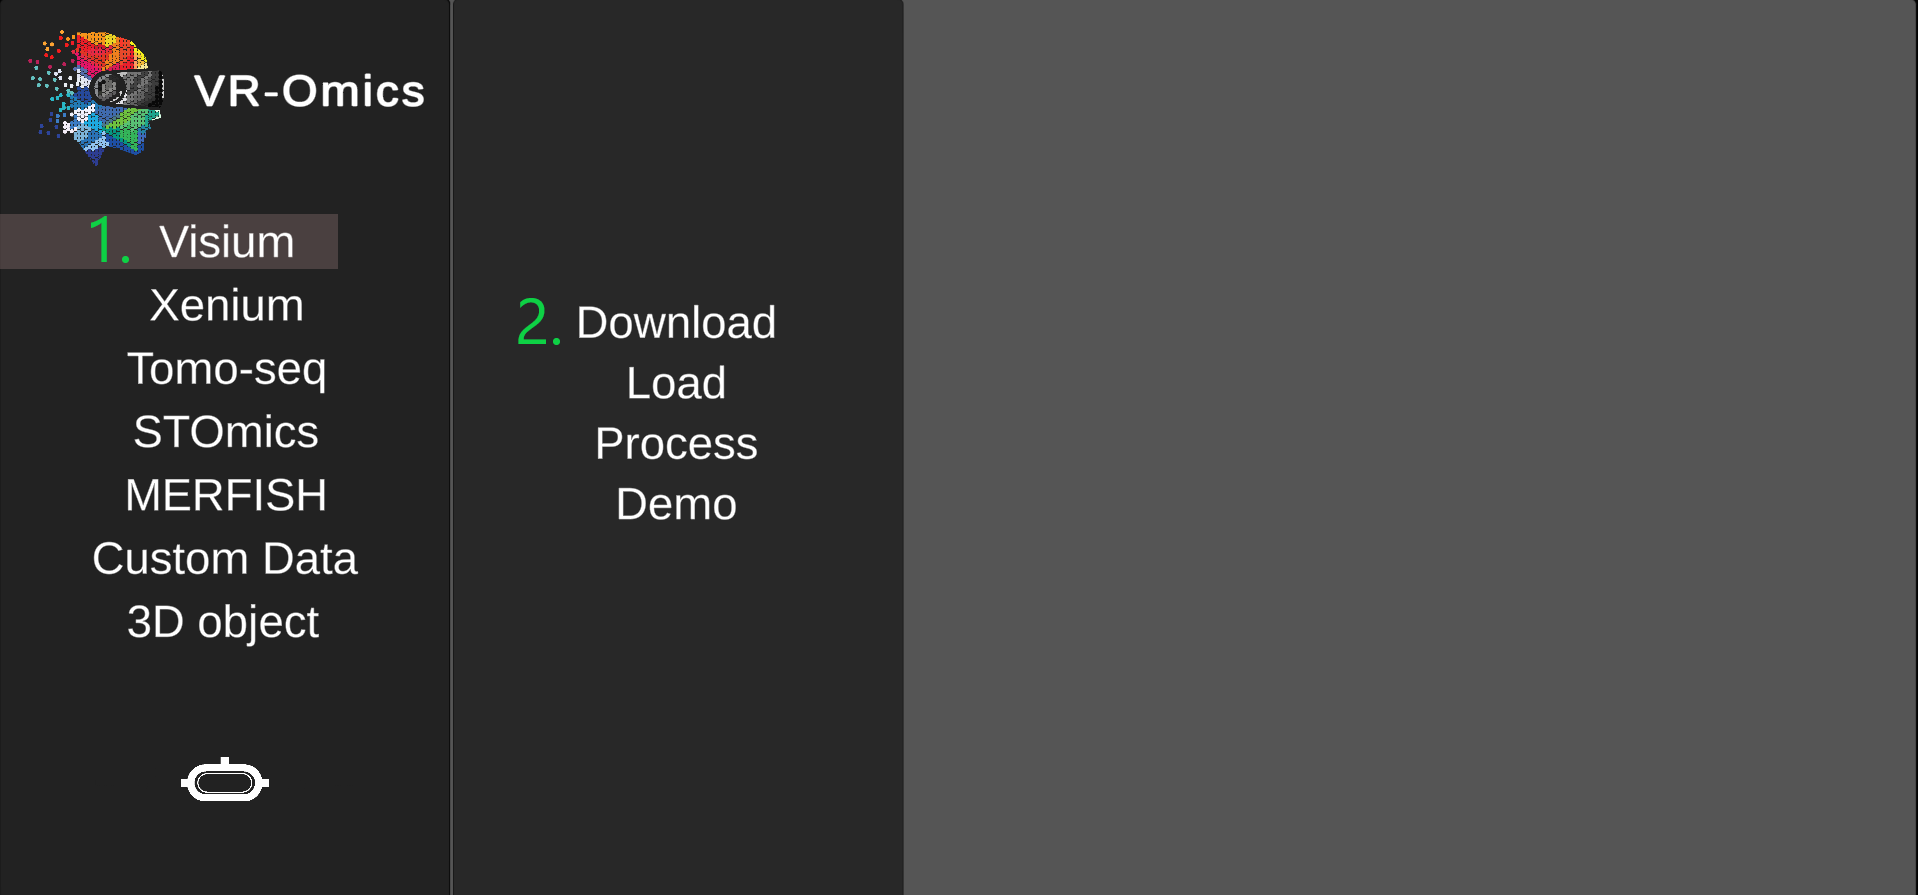
Visium
Download
| 1 | Download dataset without filter or spatial analysis |
|

The data will be downloaded from the 10X Genomics Resources Website and processed to be read in VR-Omics The data will be stored in the VR-Omics folder on your local machine.../VR-Omics/Assets/PythonFiles/sample/ To Visualise the data select the Visium Load function and select the whole folder from the Browse menu.
|
|---|---|---|---|
| 2 | Download and filter dataset
Combinable with: Spatial Analysis Output Plots Filter |
|
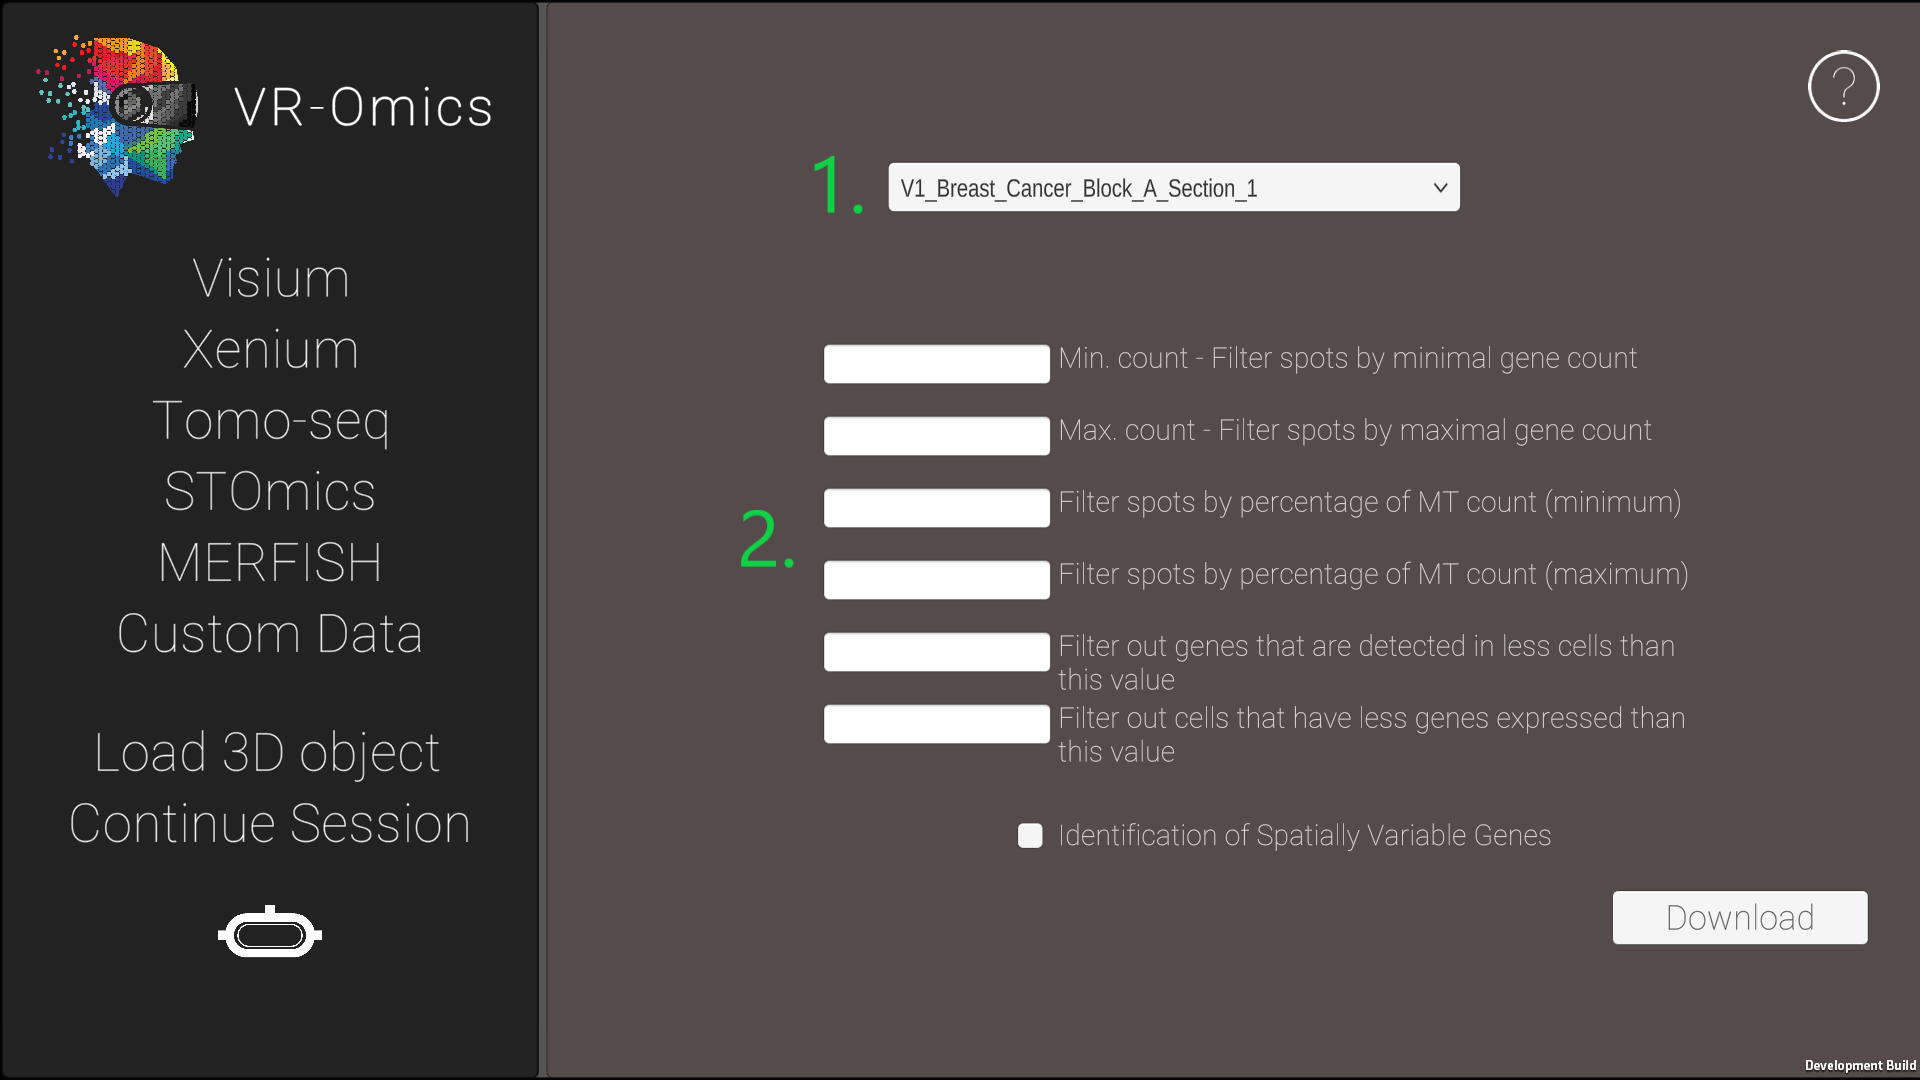
Image 1. + 2. see options menu.
The data will be downloaded from the 10X Genomics Resources Website and processed to be read in VR-Omics The data will be stored in the VR-Omics folder on your local machine.../VR-Omics/Assets/PythonFiles/sample/ To Visualise the data select the Visium Load function and select the whole folder from the Browse menu.
|
| 3 | Download dataset and perform spatial analysis
Combinable with: Filter Output Plots |
|
Image 1. + 2. see options menu.
The data will be downloaded from the 10X Genomics Resources Website and processed to be read in VR-Omics The data will be stored in the VR-Omics folder on your local machine.../VR-Omics/Assets/PythonFiles/sample/ To Visualise the data select the Visium Load function and select the whole folder from the Browse menu.
|
| 4 | Download data and include output plots
Combinable with: Filter Spatial Analysis |
|
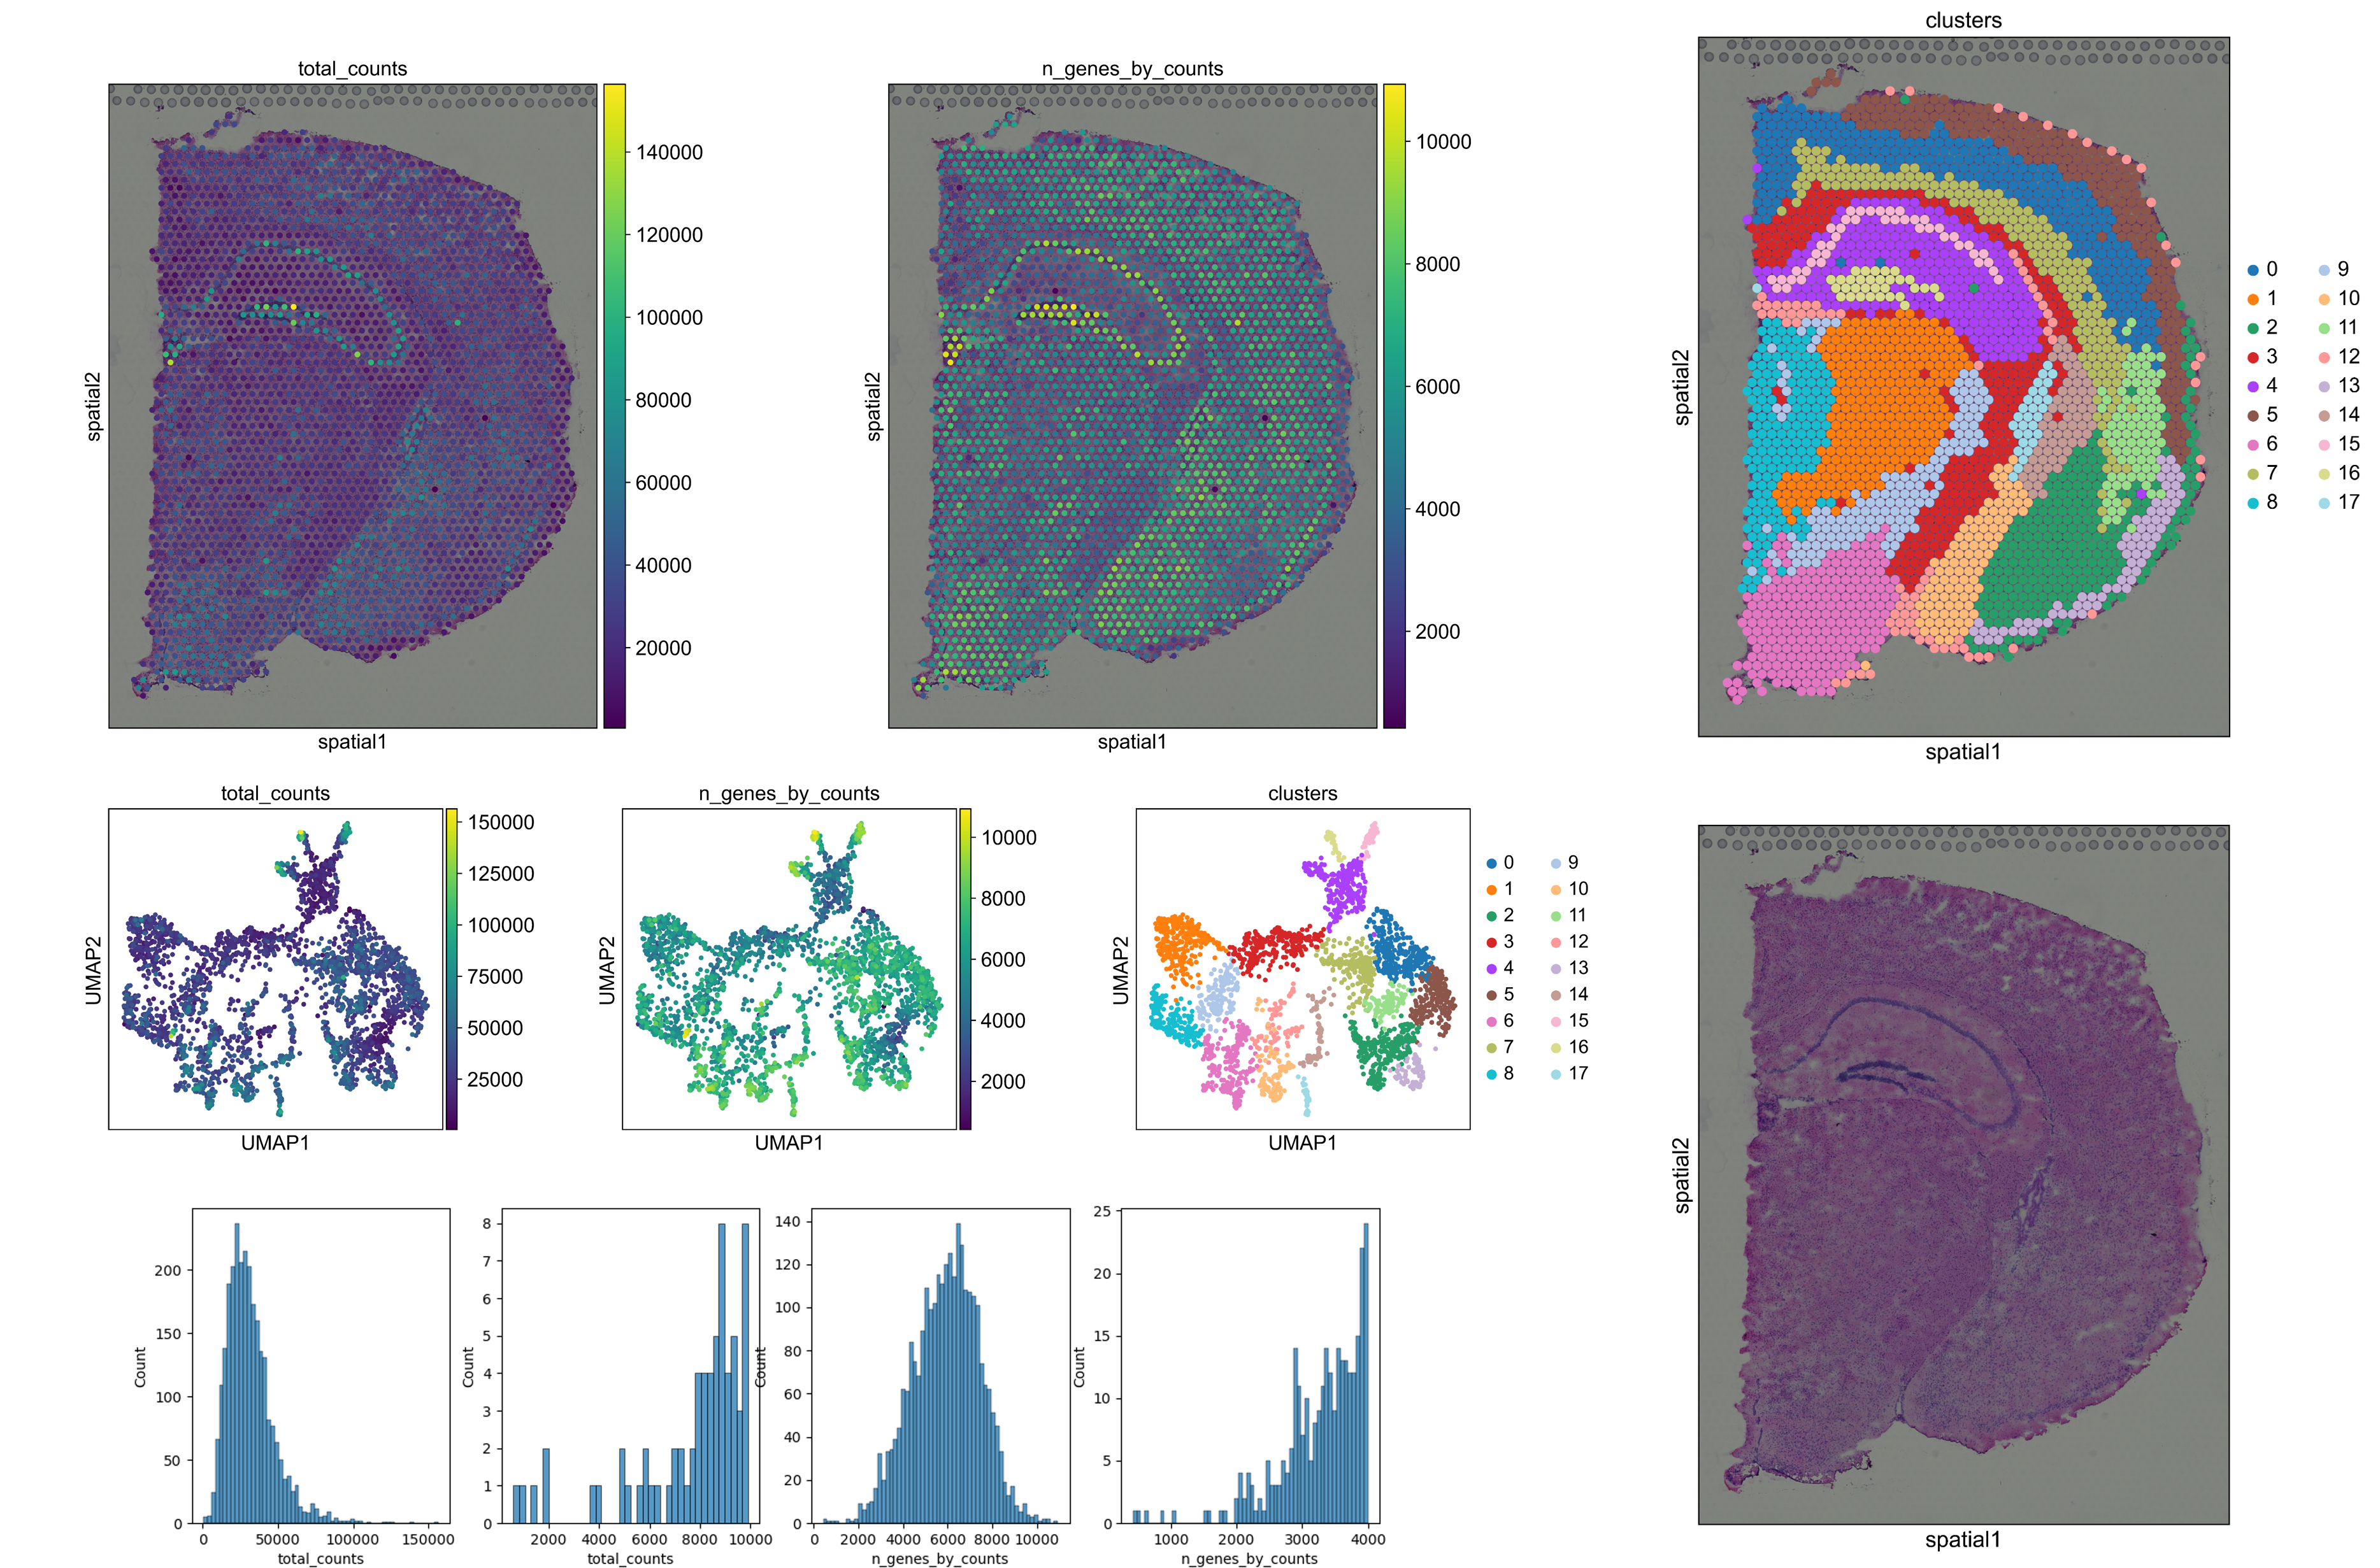
The automated workflow will produce a variety of output plots including:
For more details see export plots section.
The download menu accesses the 10X Genomics Resources Website and downloads the requested data automatically, while processing it to be read by the VR-Omics Visualiser. The data will be stored in the VR-Omics folder on your local machine.../VR-Omics/Assets/PythonFiles/sample/ To Visualise the data select the Visium Load function and select the whole folder from the Browse menu.
|
Load
Merging multiple Visium slides into one dataset
| 1 | Load multiple Visium datasets |
|
* The folder will be in the right format if the sample was downloaded using the VR-Omics Automated Workflow or the Sample has been processed using the Automated Workflow beforehand.
|
|---|---|---|---|
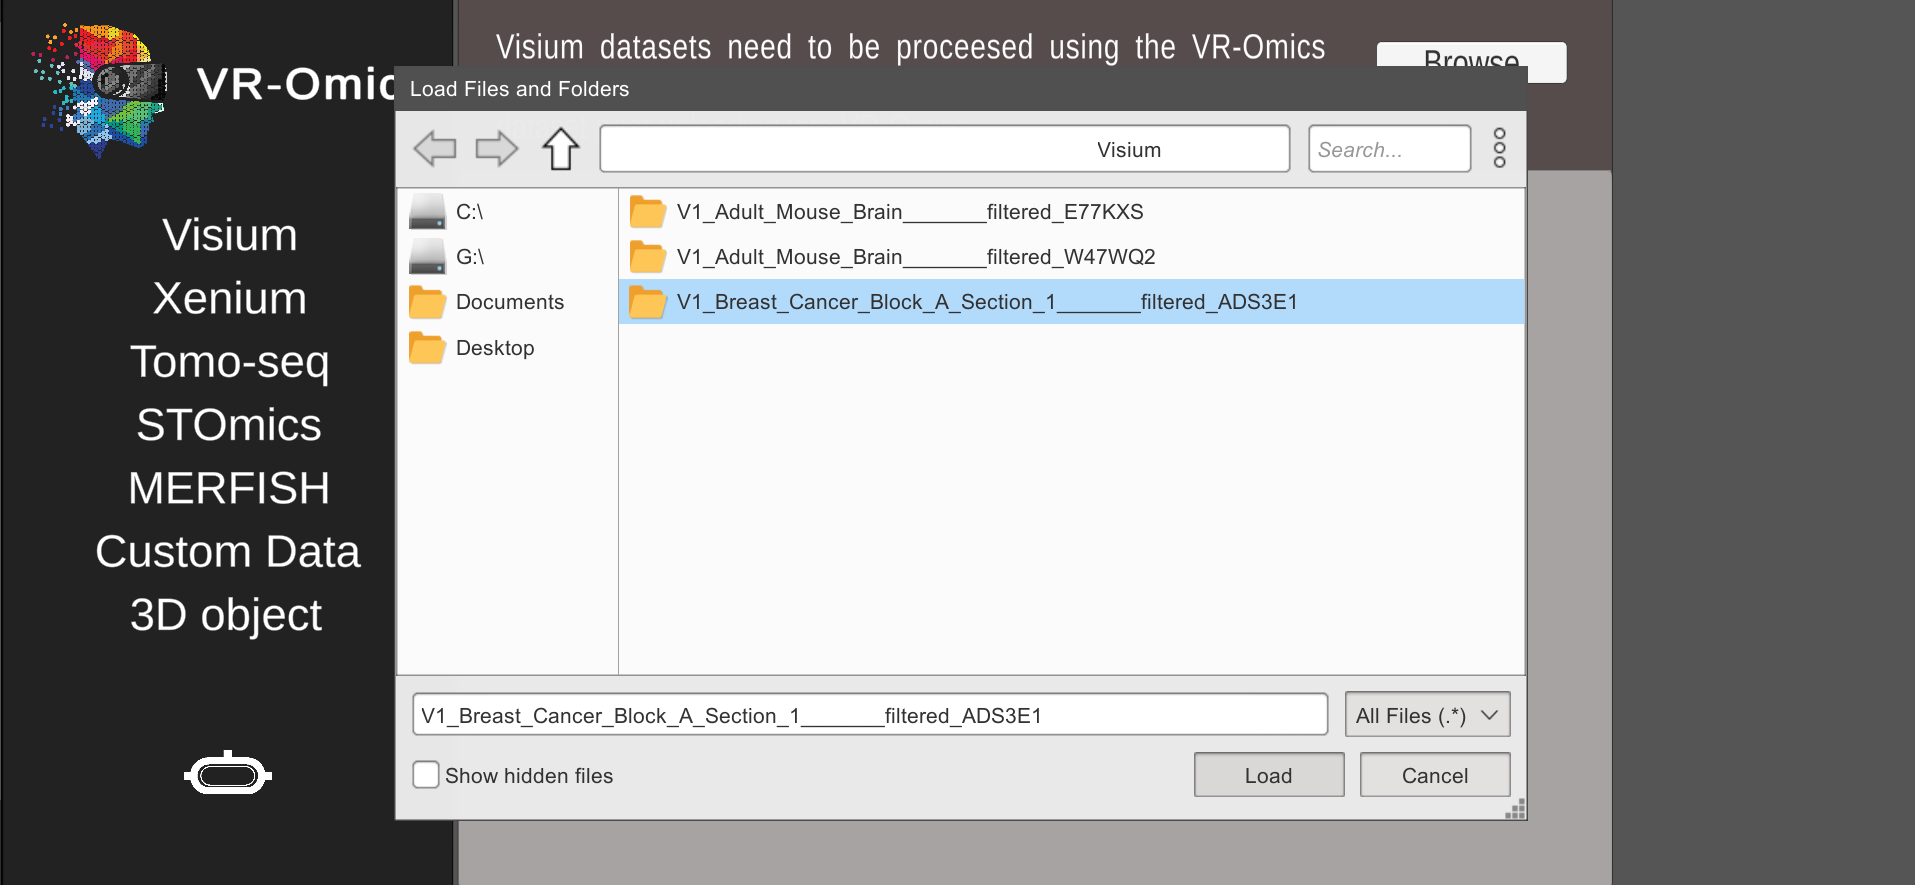
| 2 | Select sample folders | Select all sample folders (main folder of the dataset) in the Explorer menu and click Load |
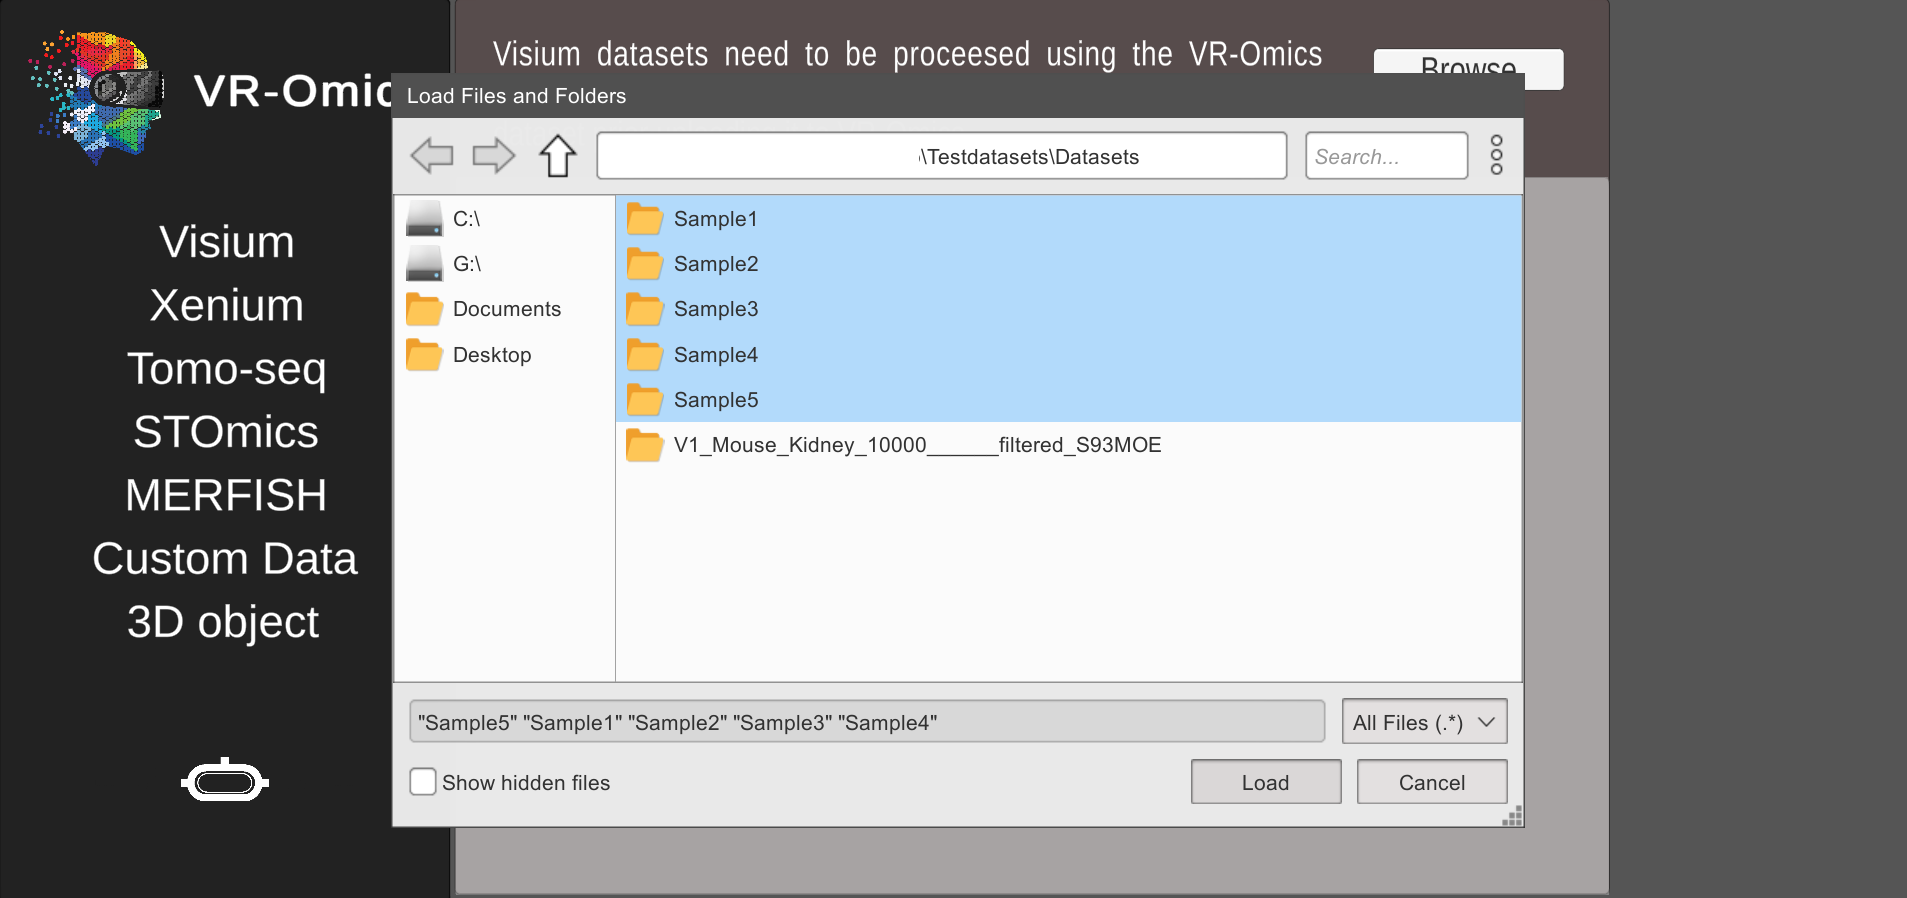
|
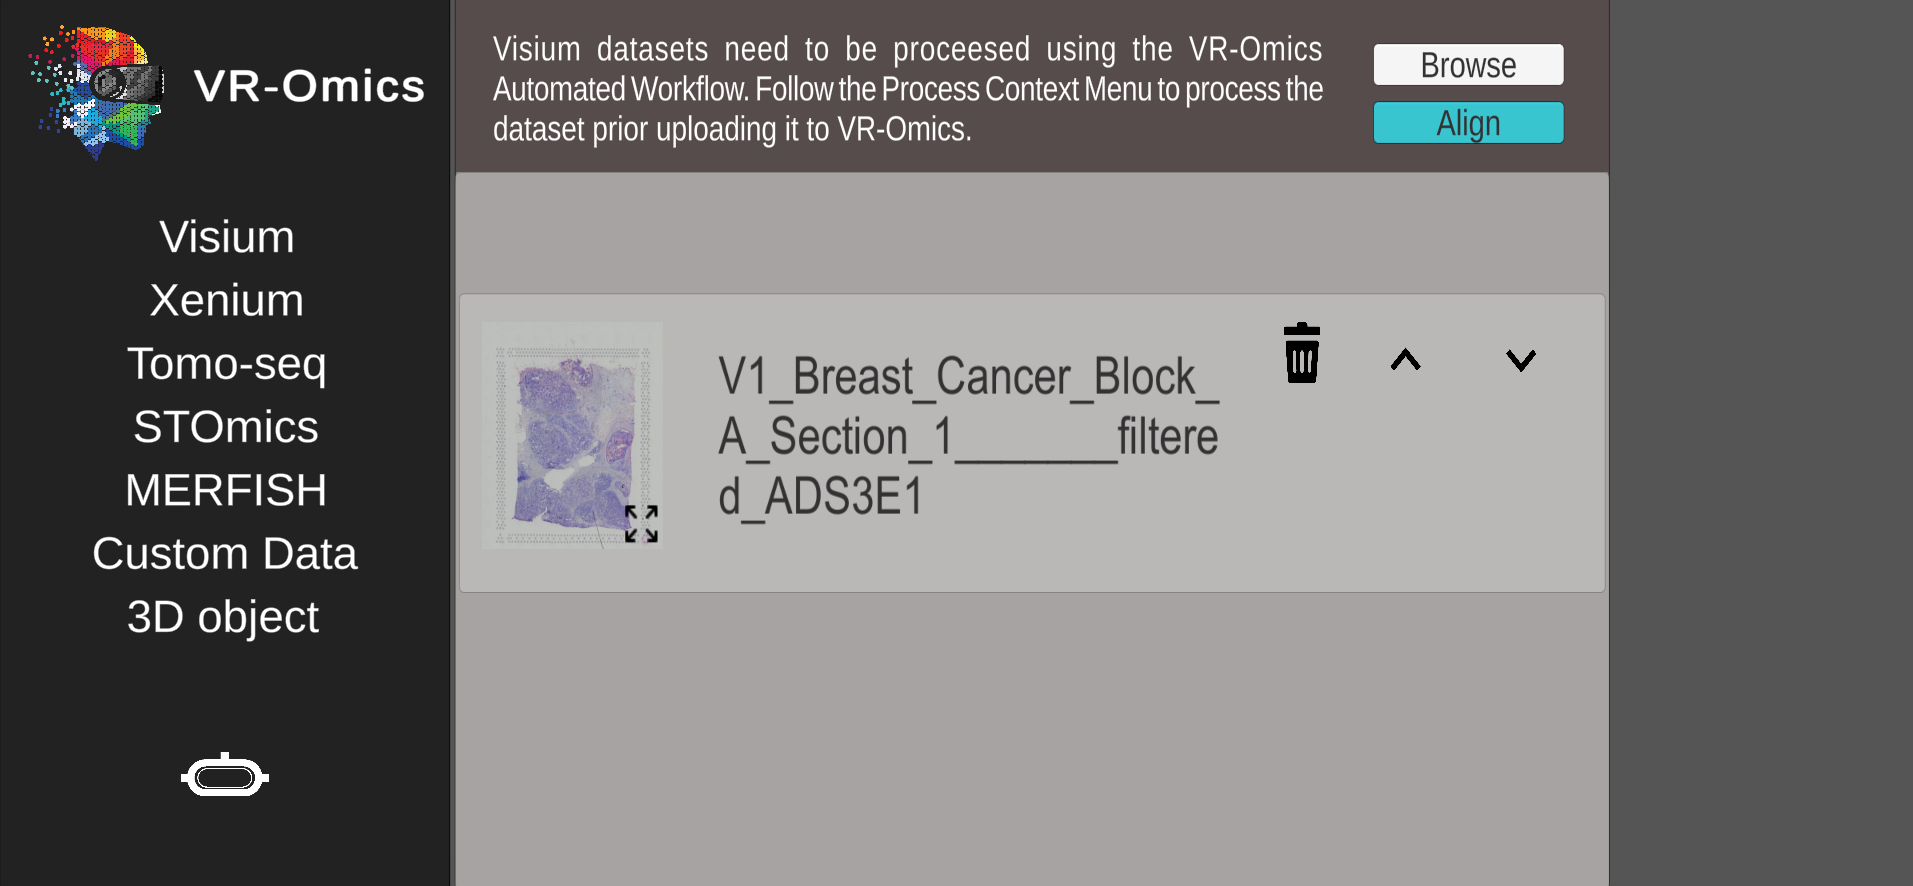
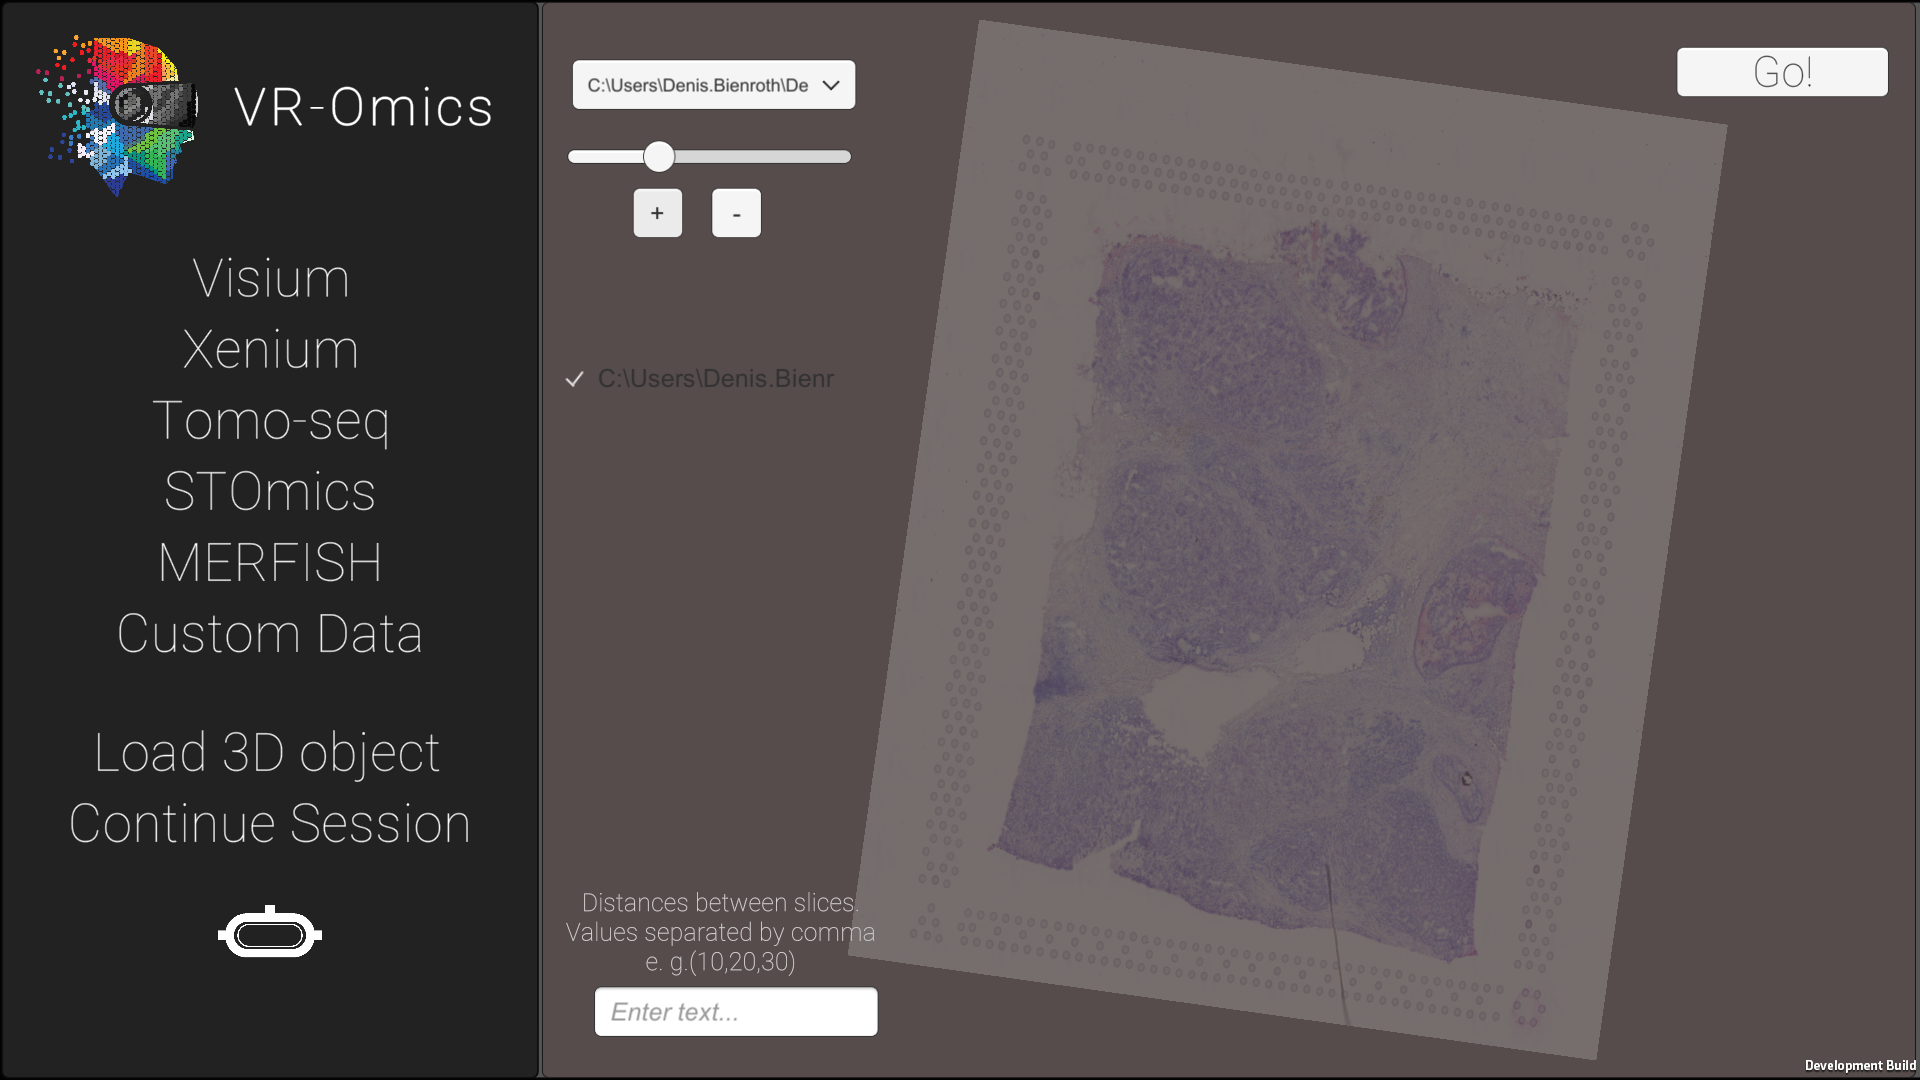
| 3 | Arrange the order of the samples |
Each sample will be shown in an individual container, showing the respective stained tissue image, the name of the sample, and the order in how the samples should be mapped into 3D context from top town. Arrange the order of the samples by clicking ˄ or ˅. Delete a sample by pressing the bin button 🗑. The tissue image can be expanded by clicking the expand button on the image. |
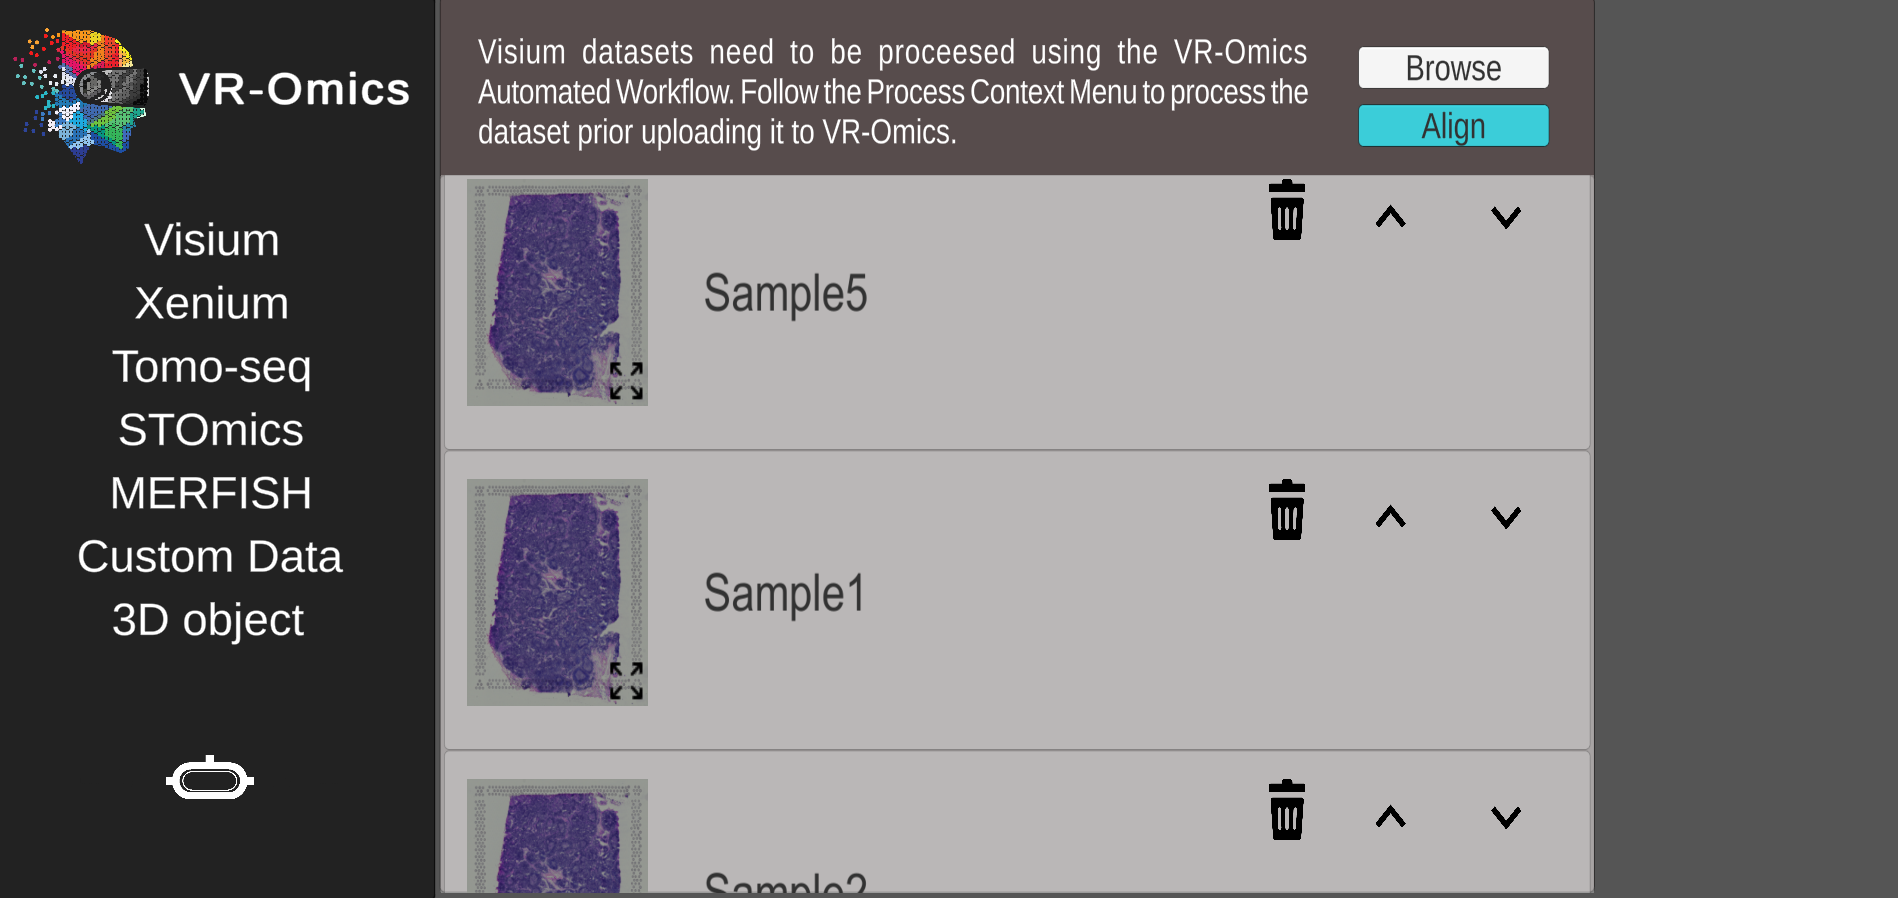
If the tissue image wasn't found a default VR-Omics placeholder will appear. This means the file wasn't identified. Please ensure that the respective file is named The dataset can be visualised and explored without a tissue image with some limited functionalities. Therefore, skip the Alignment process by clicking Align and then Go! without changing any of the settings. |
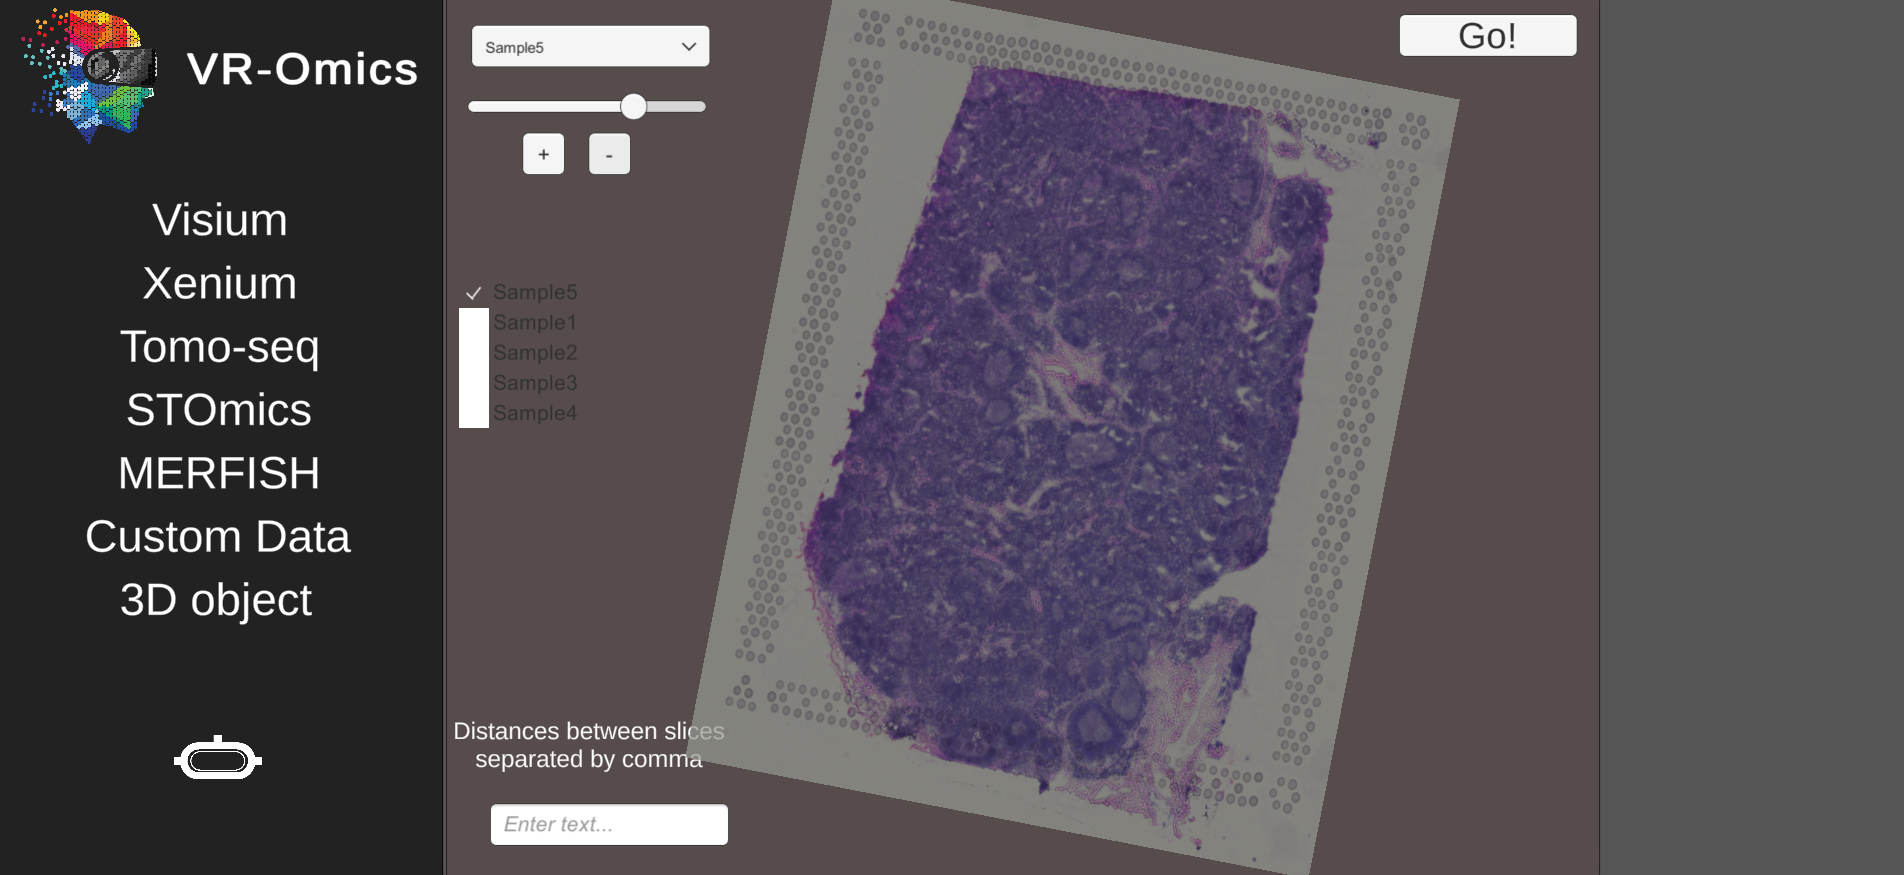
| 4 | Rotate the samples in the 3D mapping tool |
From the dropdown select which sample to operate on, all other samples are fixed. Use the slider to set the transparency of the current selected sample. Tick the boxes of each sample that currently should be visualised. All unselected samples will be invisible. Use the + Button to rotate the slice clockwise or the - Button to rotate it counter clockwise. This allows aligning the samples if they have been misplaced or rotated on the capture area. The slices can still be rotated in the VR-Omics Visualiser later to further adjust them. |
|
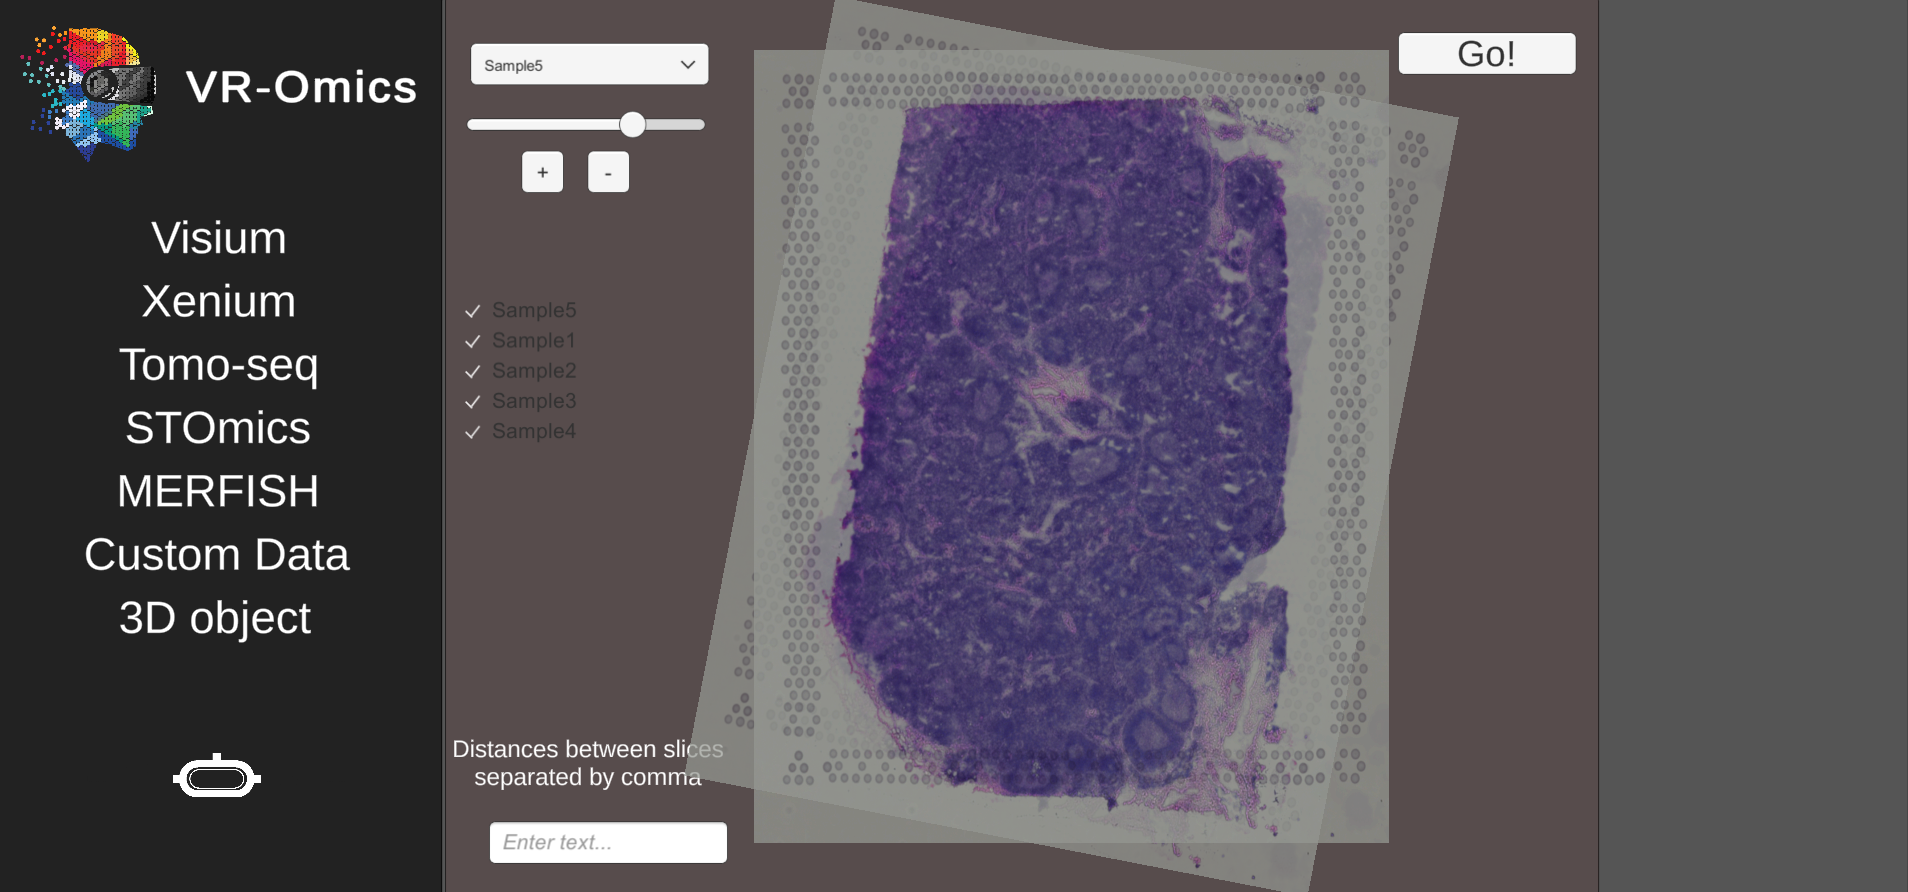
| 5 | Set the distances between the samples |
In the text box at the bottom left enter the distances between the samples. The distances are applied from front to back. The first value sets the distance between the first and the second slide. The second value sets the distance between slice two and three. Enter the values separated by a comma (e. g. 10,20,50,10) Click the Go! button if all adjustments are made to visualise the combined dataset in the VR-Omics Visualiser. |
|
Using a single Visium slide
| 1 | Load a single Visium dataset |
|
* The folder will be in the right format if the sample was downloaded using the VR-Omics Automated Workflow or the Sample has been processed using the Automated Workflow beforehand.
|
|---|---|---|---|
| 2 | Select sample folder | Select the sample folder (main folder of the dataset) in the Explorer menu and click Load |
|
| 3 | Confirm selection |
The sample will be shown in a container showing the tissue image that can be expand by clicking on the button in the image. Select the sample by clicking Align |
If the tissue image wasn't found a default VR-Omics placeholder will appear. This means the file wasn't identified. Please ensure that the respective file is named The dataset can be visualised and explored without a tissue image with some limited functionalities. Therefore, skip the Alignment process by clicking Align and then Go! without changing any of the settings. |
| 4 | Rotate the samples in the 3D mapping tool |
The dropdown menu shows the name of the selected sample folder Use the slider to set the transparency of the tissue image. Use the + Button to rotate the slice clockwise or the - Button to rotate it counter clockwise. This allows aligning the samples if they have been misplaced or rotated on the capture area. The slices can still be rotated in the VR-Omics Visualiser later to further adjust them. Click the Go! button if all adjustments are made to visualise the combined dataset in the VR-Omics Visualiser. |
|
| 5 | Skip the distance input field |
Ignore the text box in the bottom left for the distances if using a single Visium slide. Click the Go! button if all adjustments are made to visualise the combined dataset in the VR-Omics Visualiser. |
|
Process
| 1 |
Process Visium dataset from local machine Combinable with: None |
|
This step needs to be performed for every dataset that was not downloaded using the VR-Omics Download option. 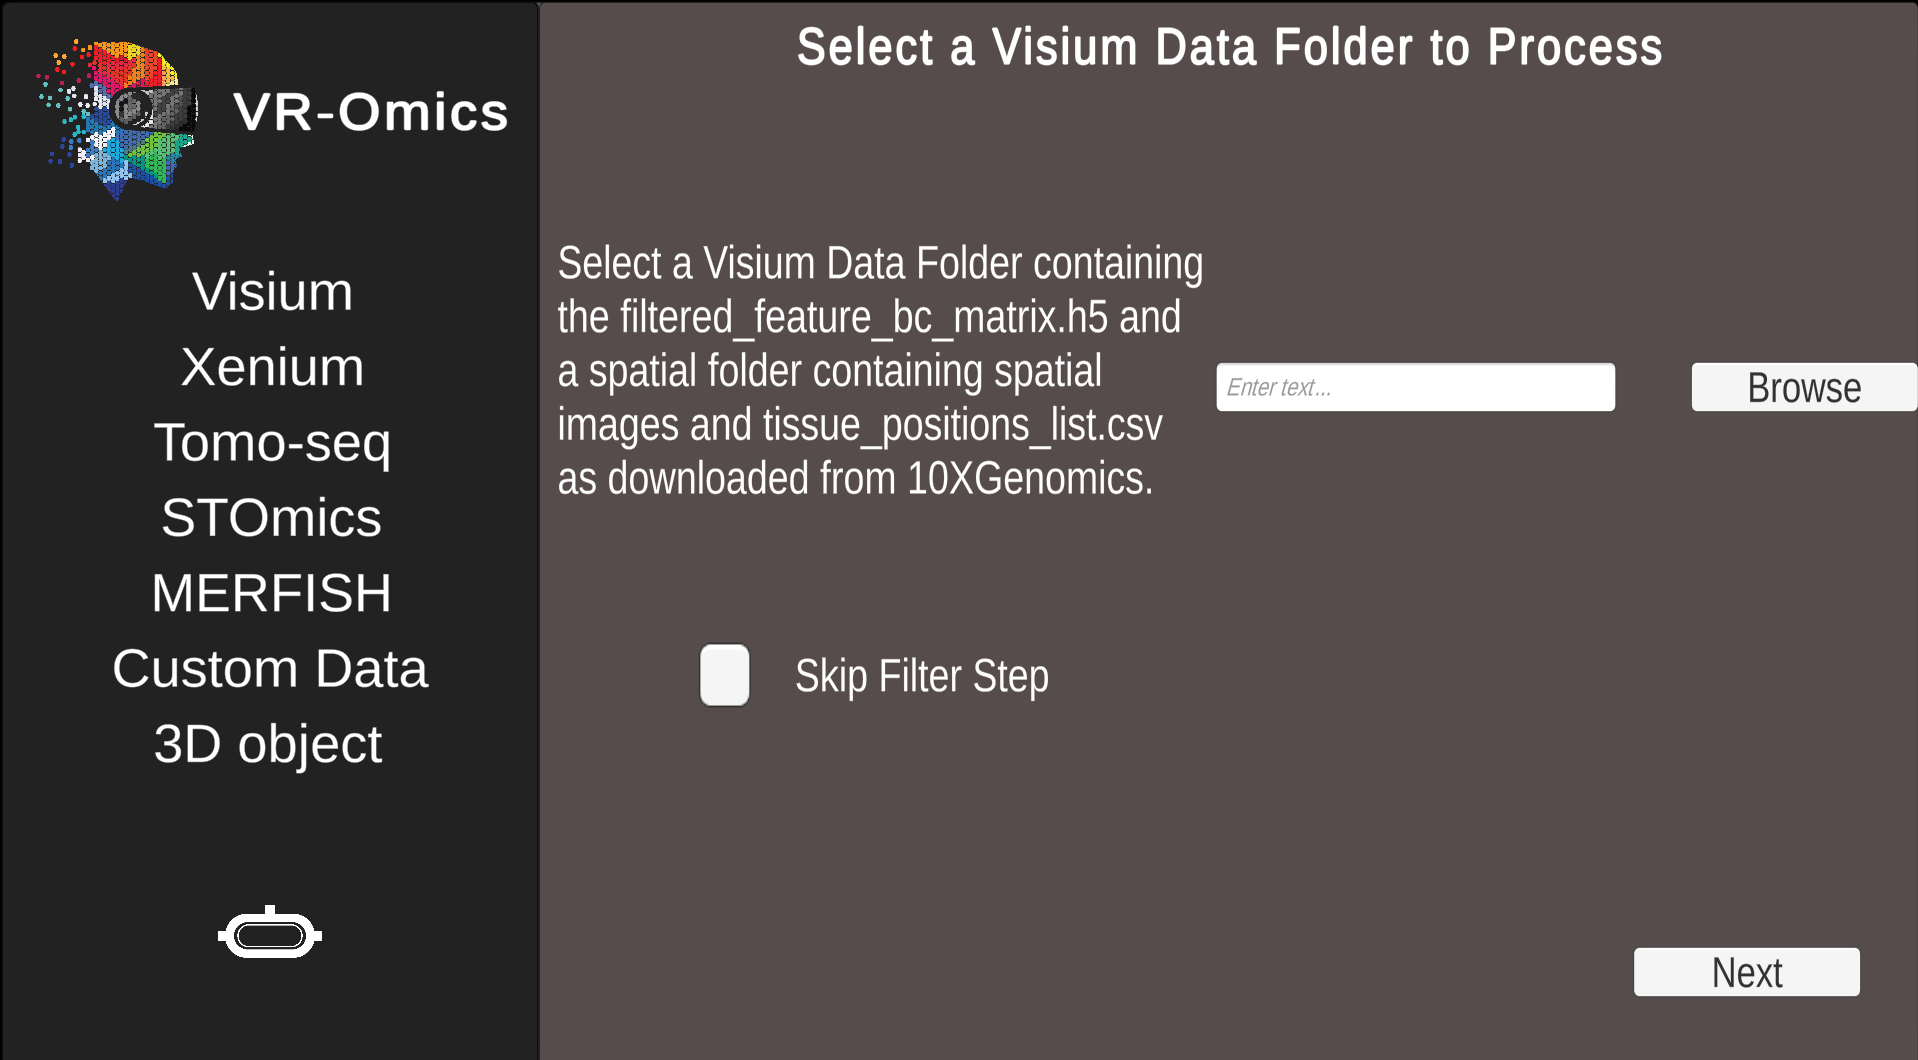
Optionally, the Skip Filter Step option can be used if the dataset does not need to be filtered. The output will be saved in the VR-Omics folder
|
|---|---|---|---|
| 2 |
Process and Filter Visium dataset from local machine Combinable with: Spatially Variable Genes |
|
The output will be saved in the VR-Omics folder
|
Demo
| 1 | Explore the Demo dataset |
|
|
|---|---|---|---|
| 2 | Demo in Visualiser |
This will automatically load the demo dataset in the VR-Omics Visualiser ready to be explored. |
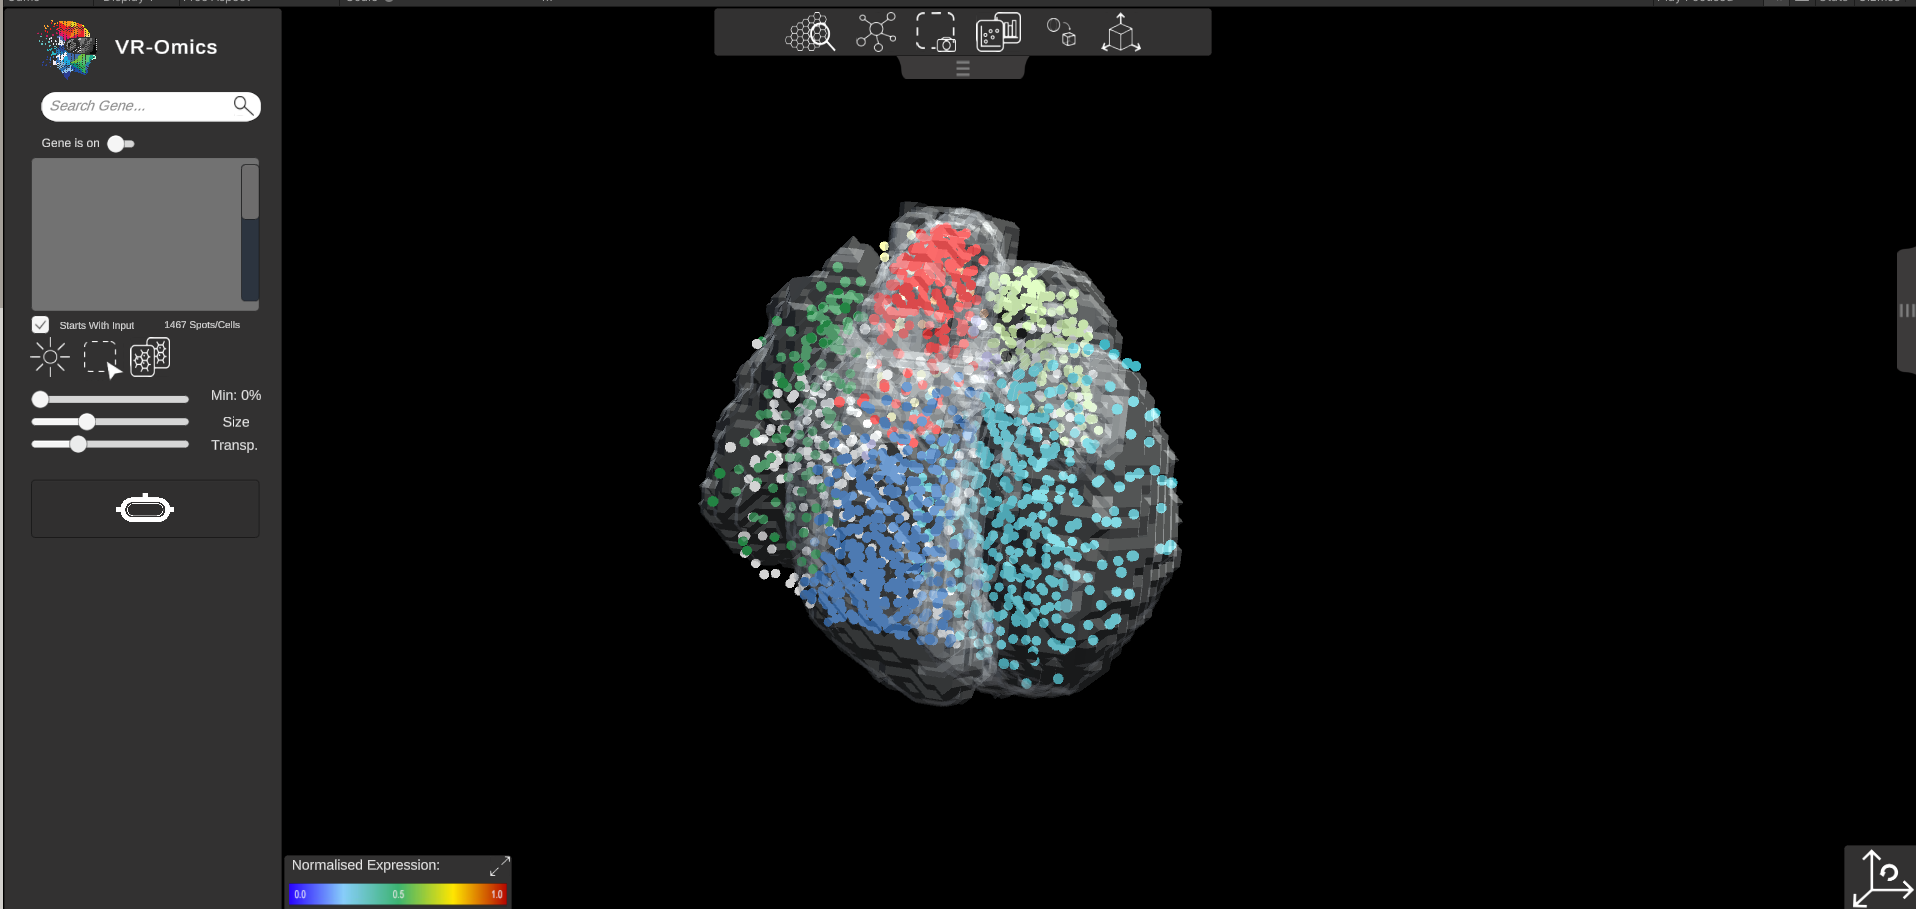
The cluster data is visualised in the screenshot, this is not the default. |
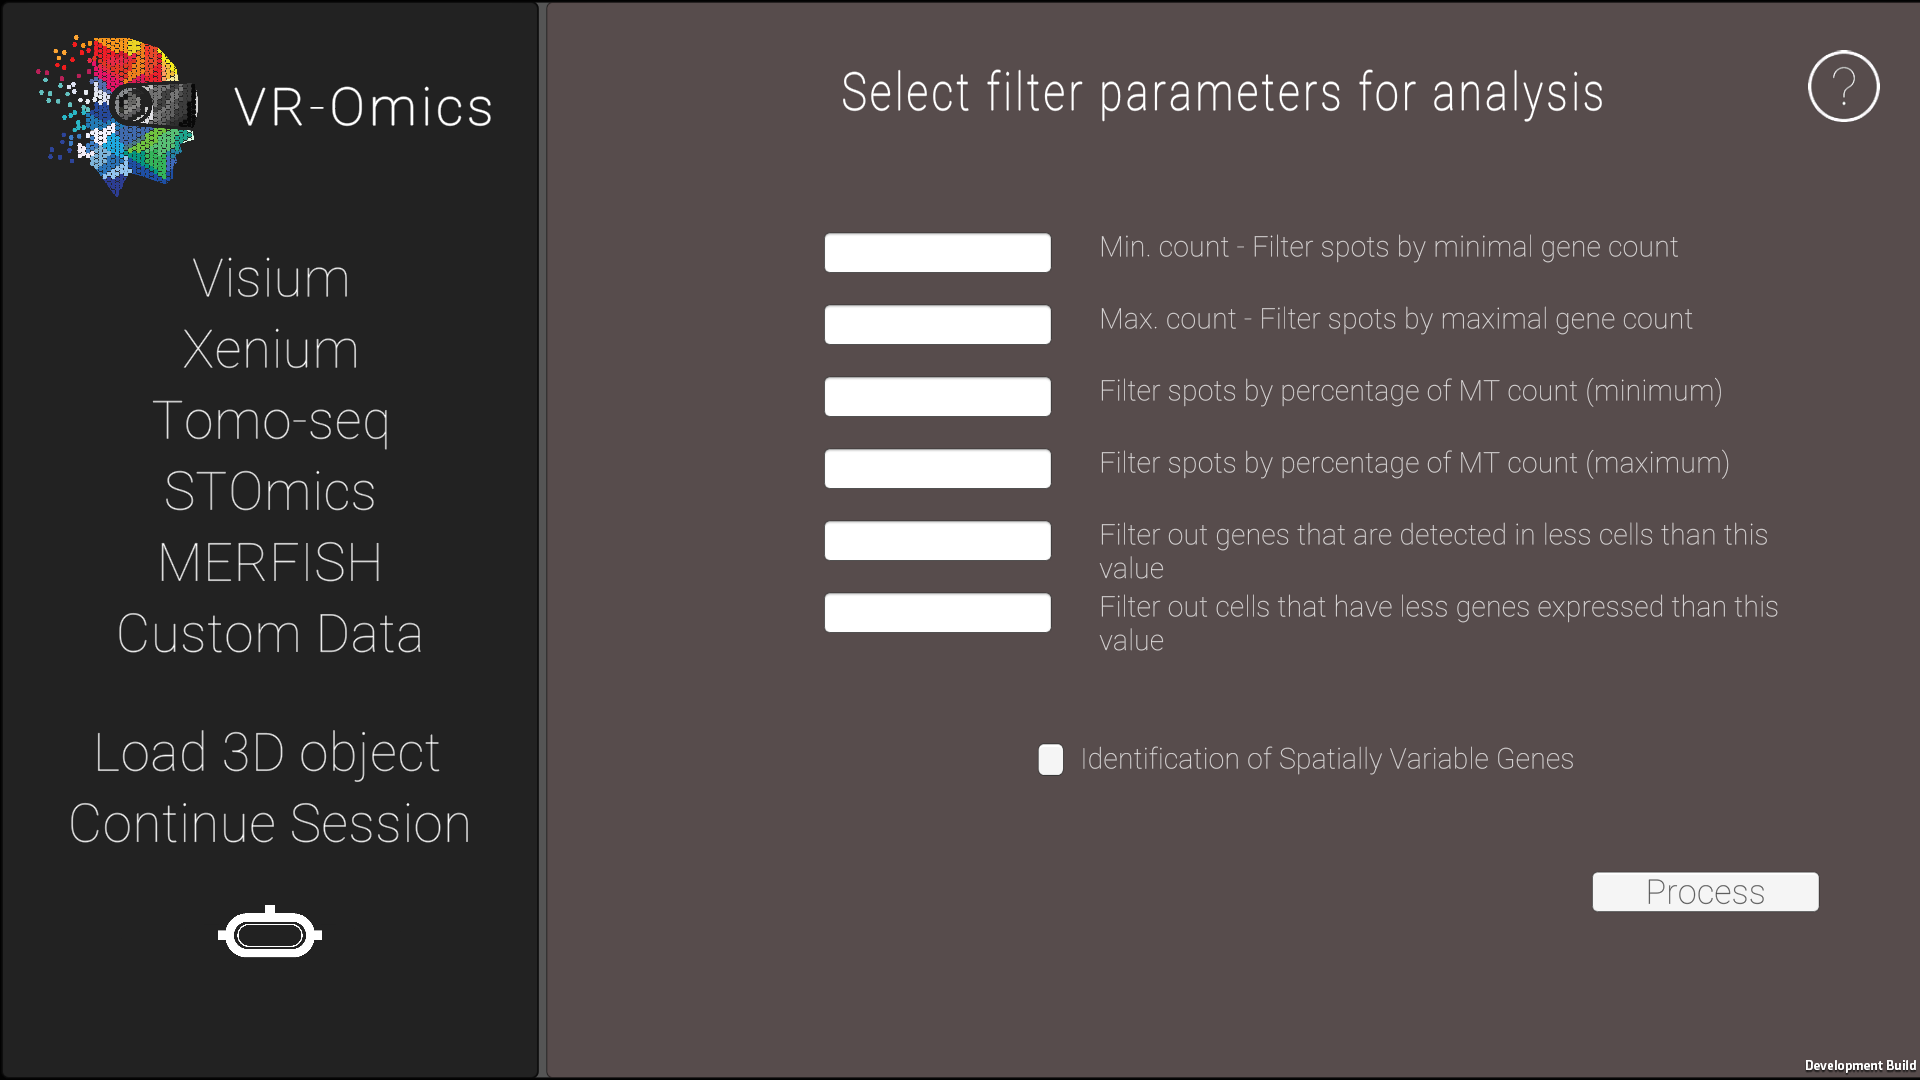
Filter parameters
|
Min.count - Filter spots by gene count |
Min.count is a filter used to exclude spots with gene expression lower than a specified value from further analysis. It is used to ensure more accurate and robust results in gene expression experiments. |
|
Max.count - Filter spots by gene count |
Max.count is a filter used to exclude spots with gene expression Lower than a specified value from further analysis. It is used to ensure more accurate and robust results in gene expression experiments. |
| Filter spots by percentage of MT count (minimum) | MT.count (minimum) is the filter parameter used to exclude spots that have a lower Mitochondrial count than the specified value. |
| Filter spots by percentage of MT count (maximum) | MT.count (maximum) is the filter parameter used to exclude spots that have a Lower Mitochondrial count than the specified value. A Low mitochondria count can be a sign of cell death or cell damage or stress. |
| Filter out genes that are detected in less spots than this value | This minium threshold filter parameter can be used to exclude all genes from the dataset that are detected in less spots than the value provided. Keep in mind the total number of genes of the dataset. VR-Omics will skip this step if this value was selected to Low so that no genes remain or if the value exceeds the total genes number of the dataset. |
| Filter out spots that have less genes expressed than this value. | This minium threshold filter parameter can be used to exclude all spots from the dataset that have less genes expressed than this value. Please keep the maximum number of spots in the dataset in mind. VR-Omics will skip this step if the value was selected so Low, that no spots would remain after analysis. |
Further information can be found in the Scanpy spatial analysis documentation.
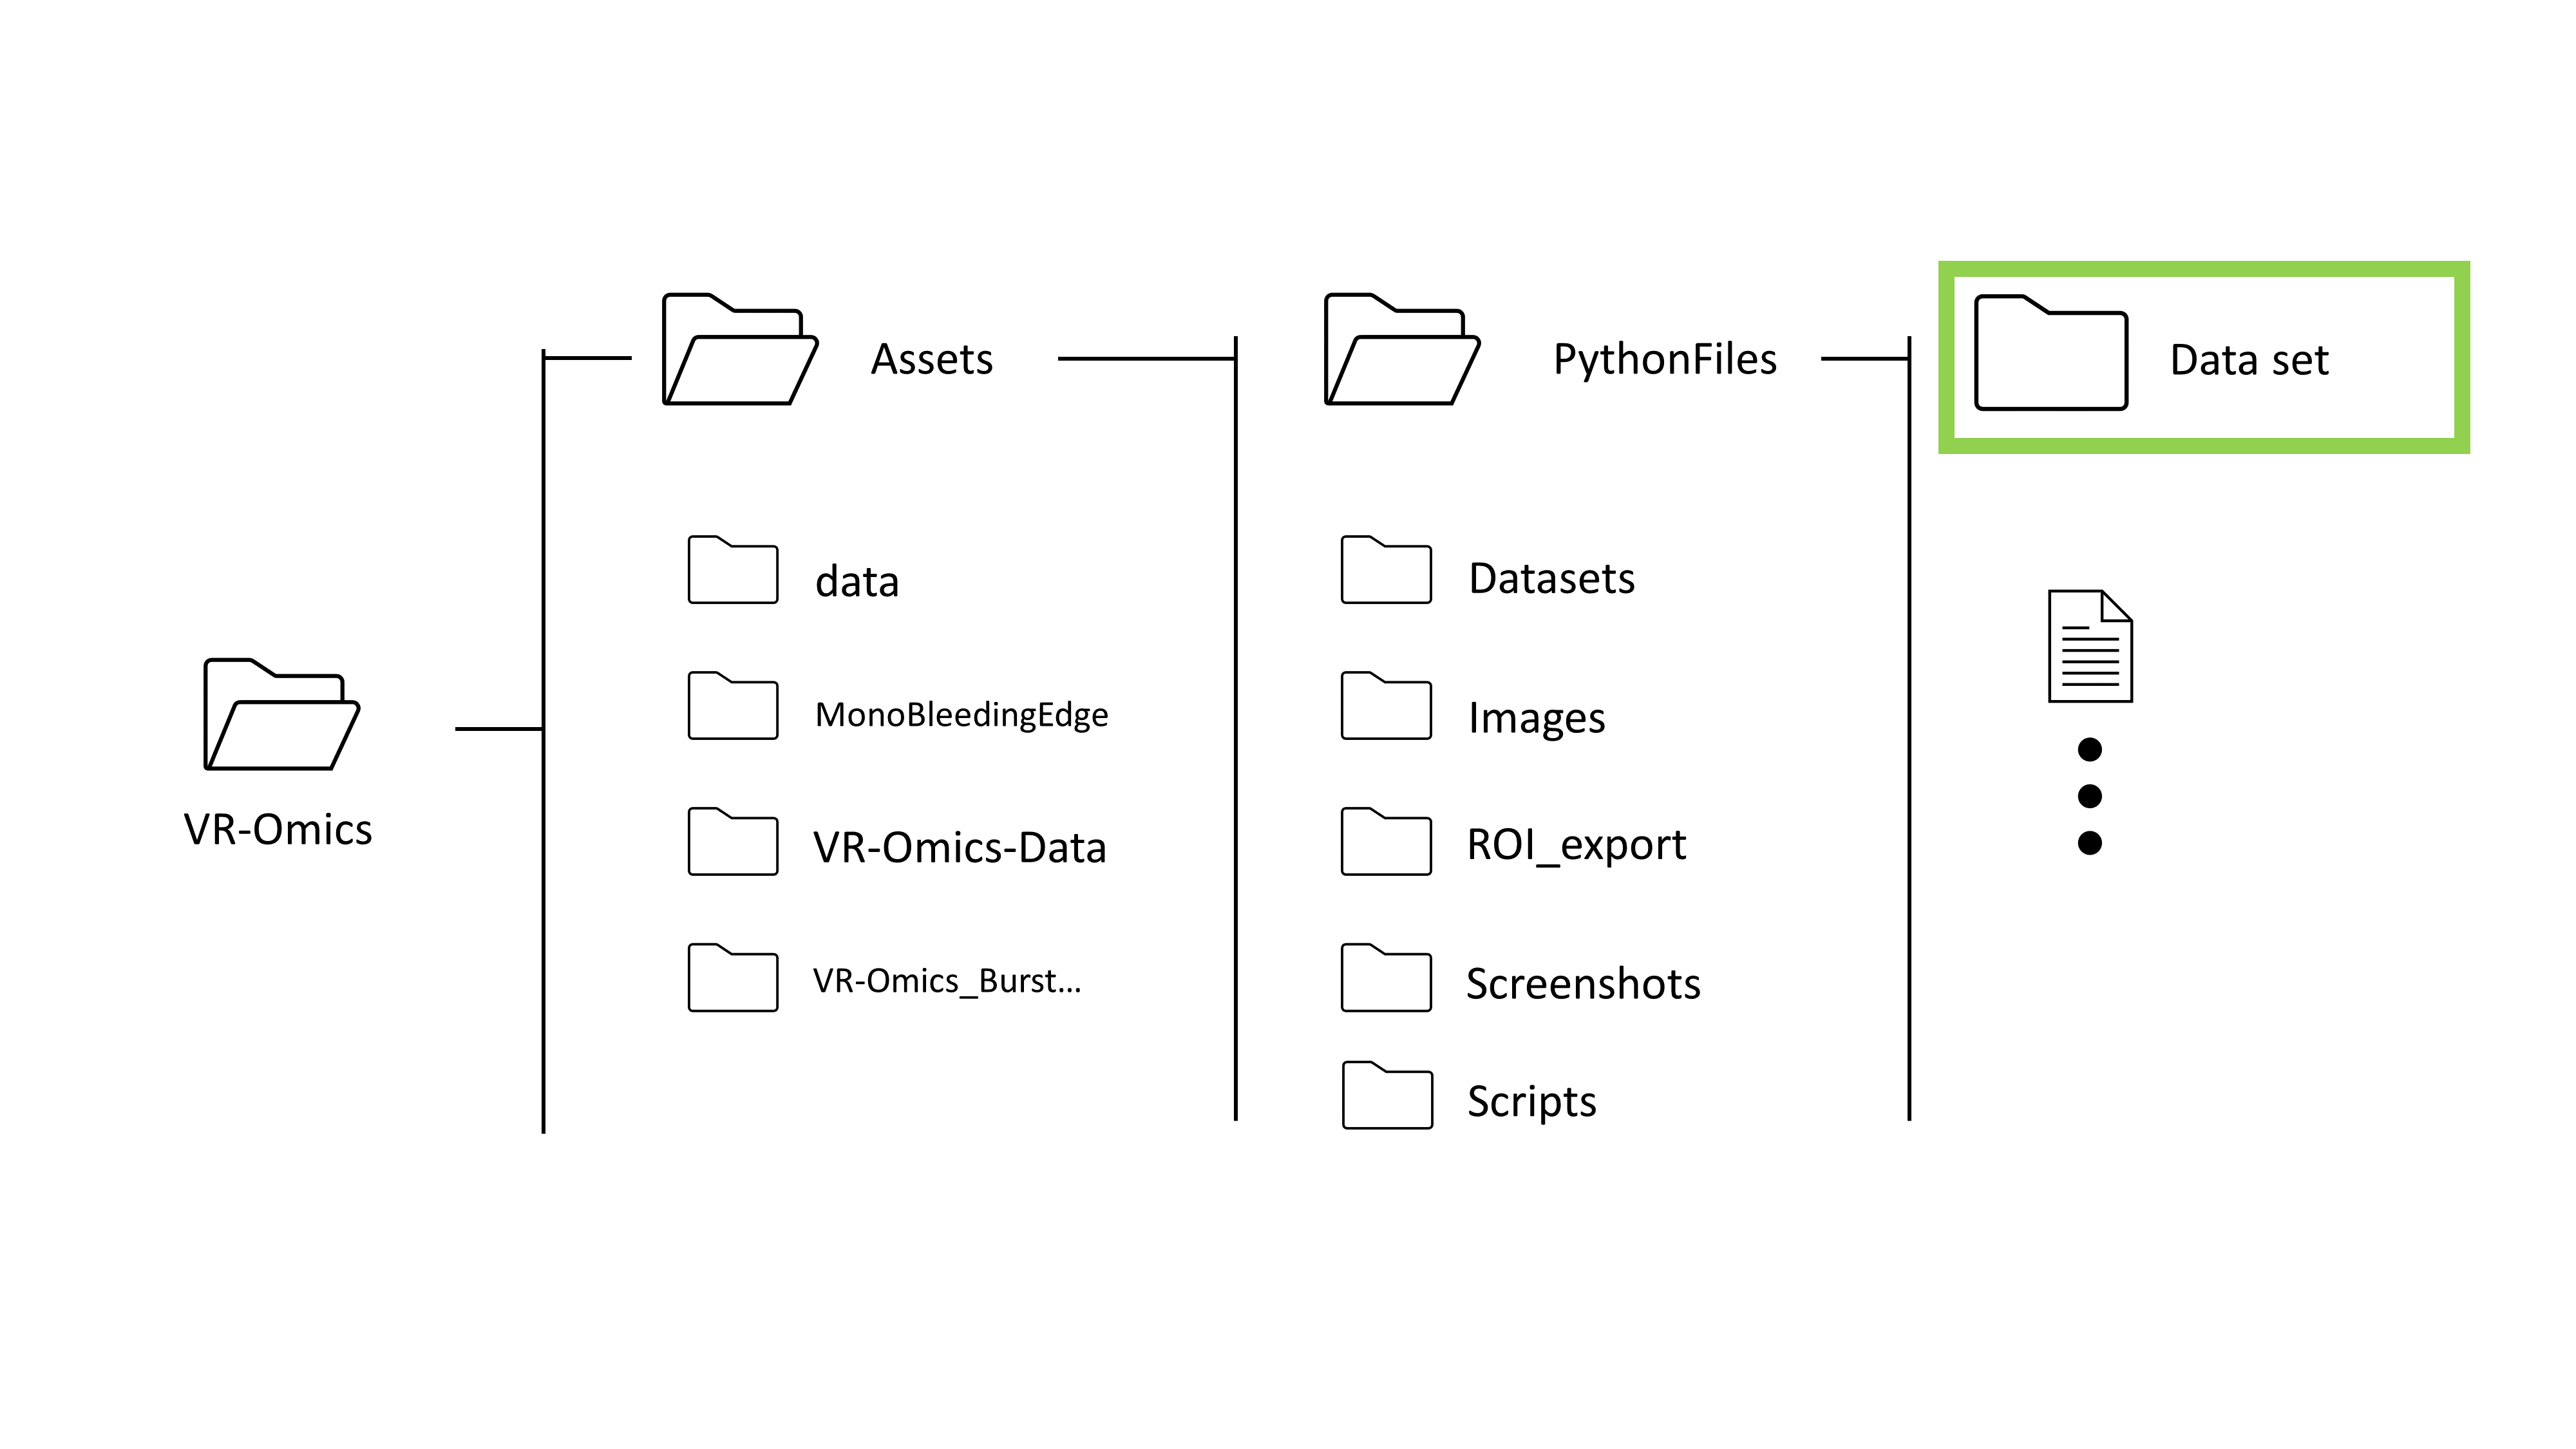
Visium folder required format
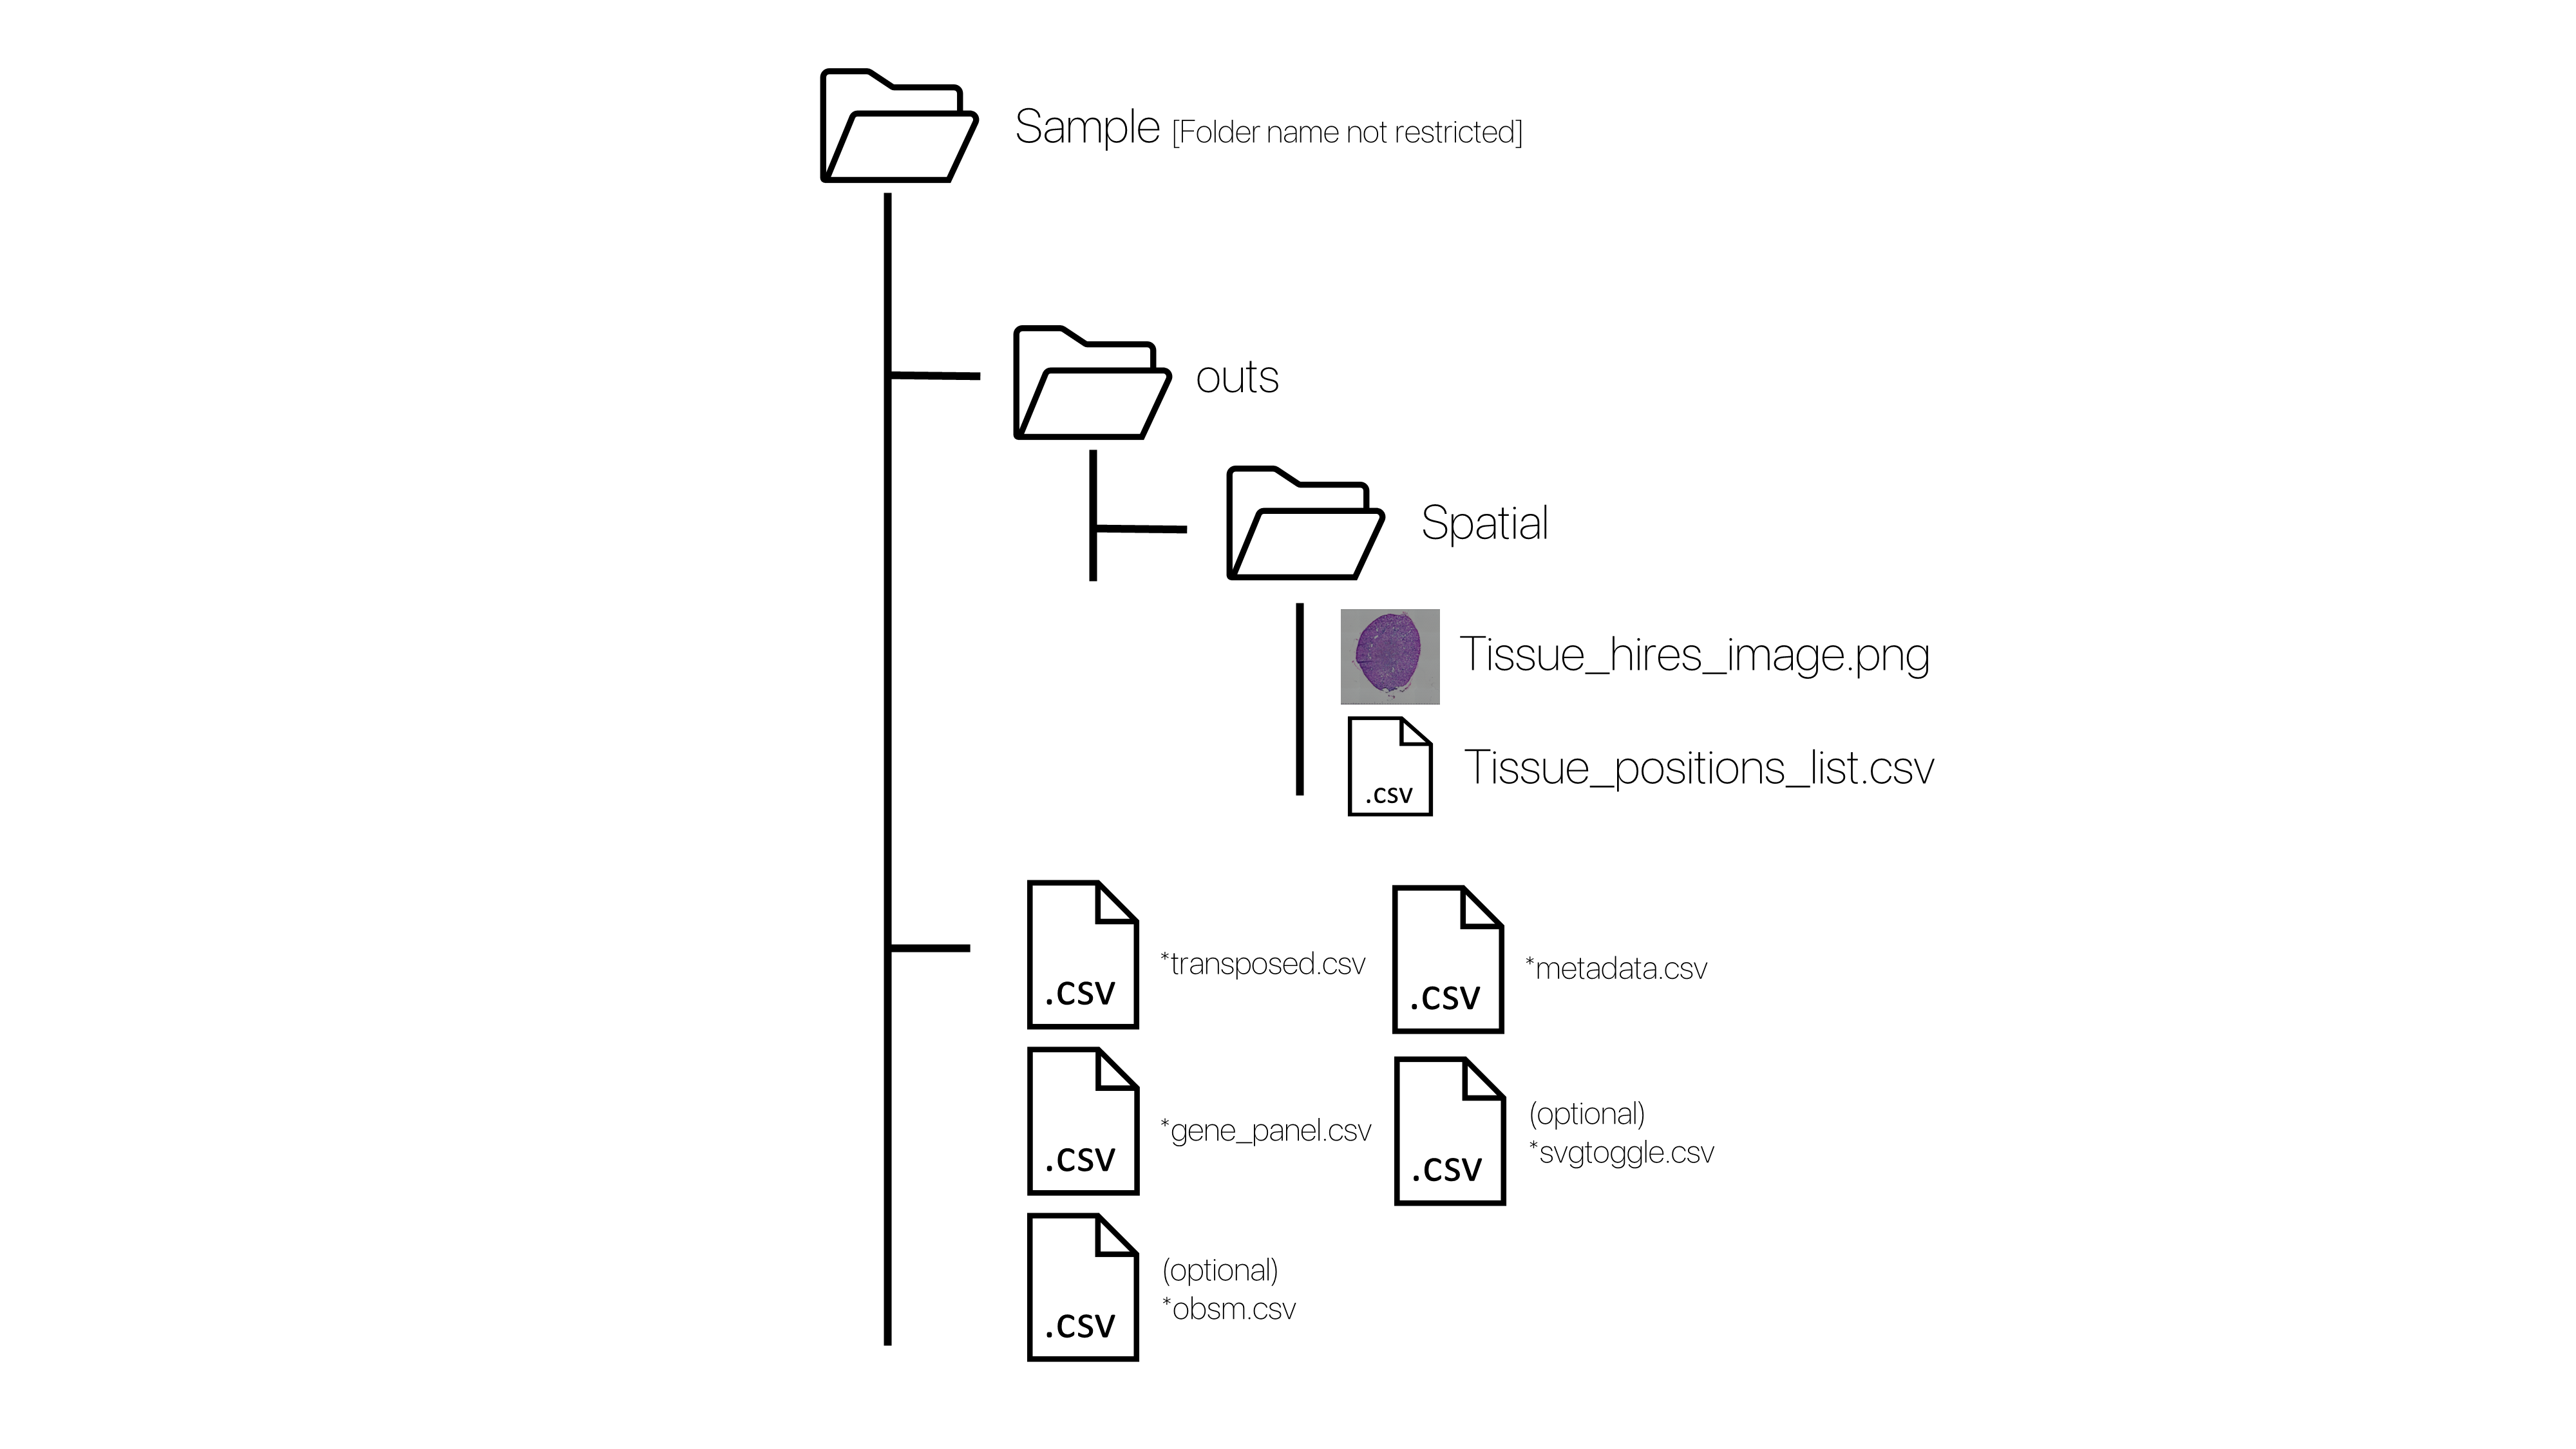
Please ensure this structure of your Visium data to use the VR-Omics Visualiser. This structure will automatically be generated by all sample datasets that are either downloaded or processed using the VR-Omics Automated Workflow.
Xenium
Process
Process Xenium data
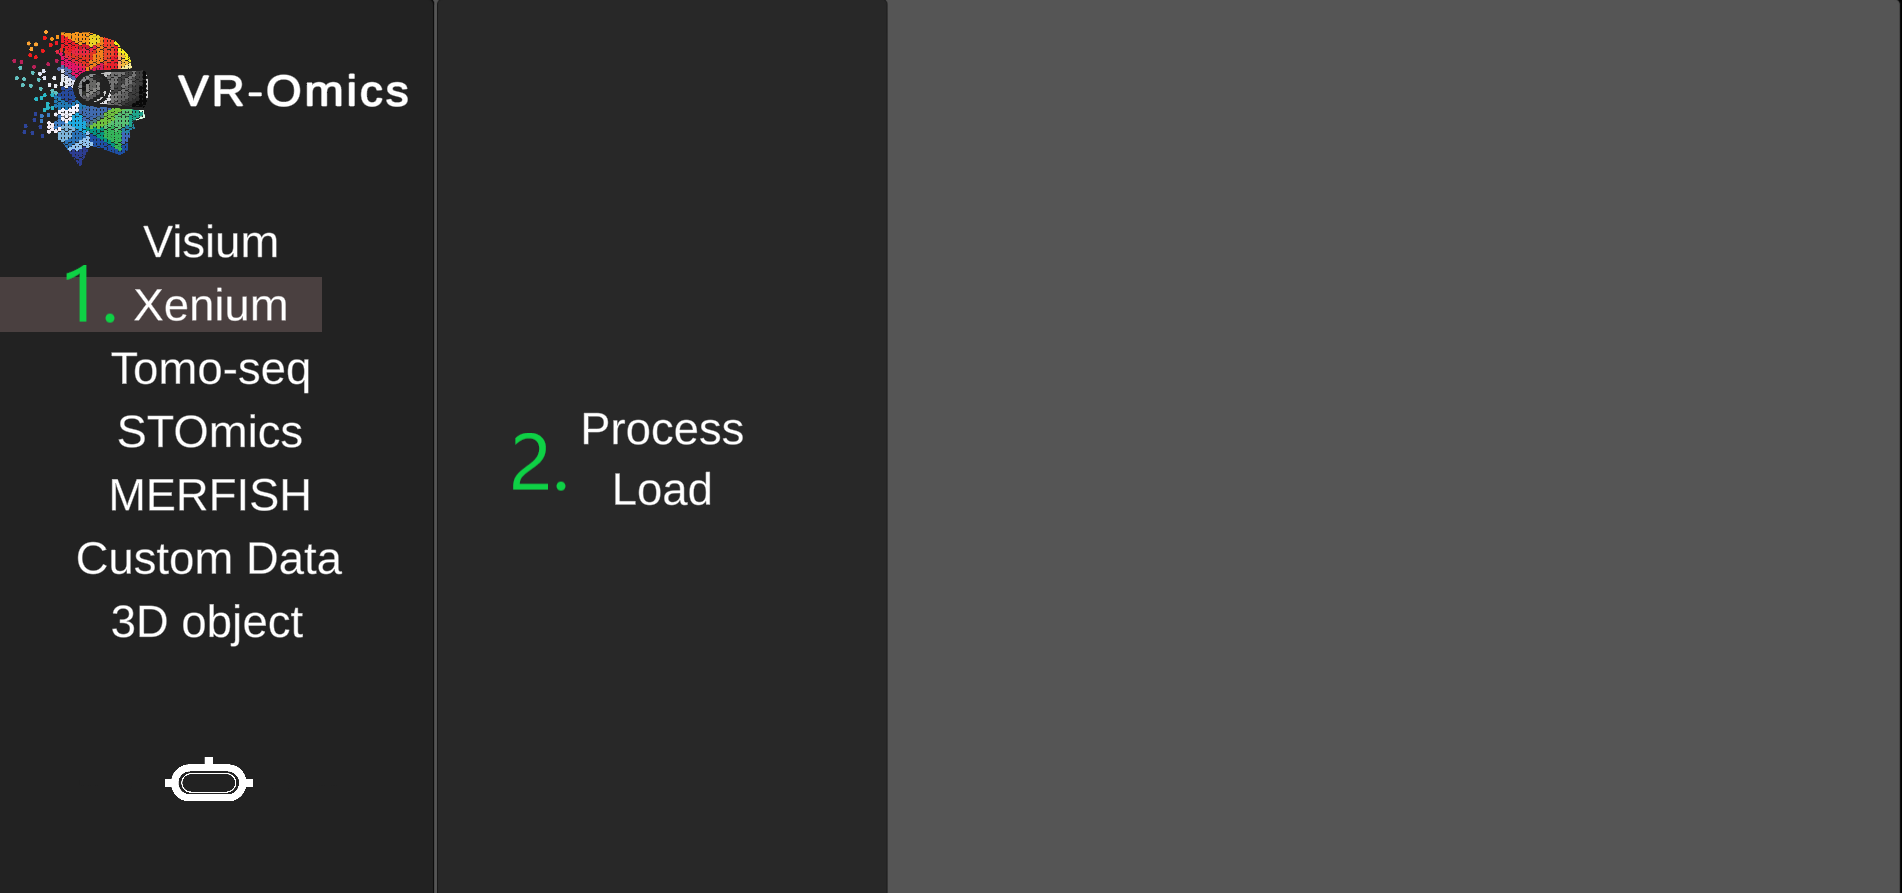
| 1 | Navigate to the Xenium process menu |
|
|
|---|---|---|---|
| 2 | Select the Xenium files |
.h5 file of the Xenium data using Browse.csv file of the Xenium data using Browse.Min Count value to filter the dataMin Cells value to filter the dataRun Full Analysis toggle if you want to perform additional spatial analysis (Moran Results) |
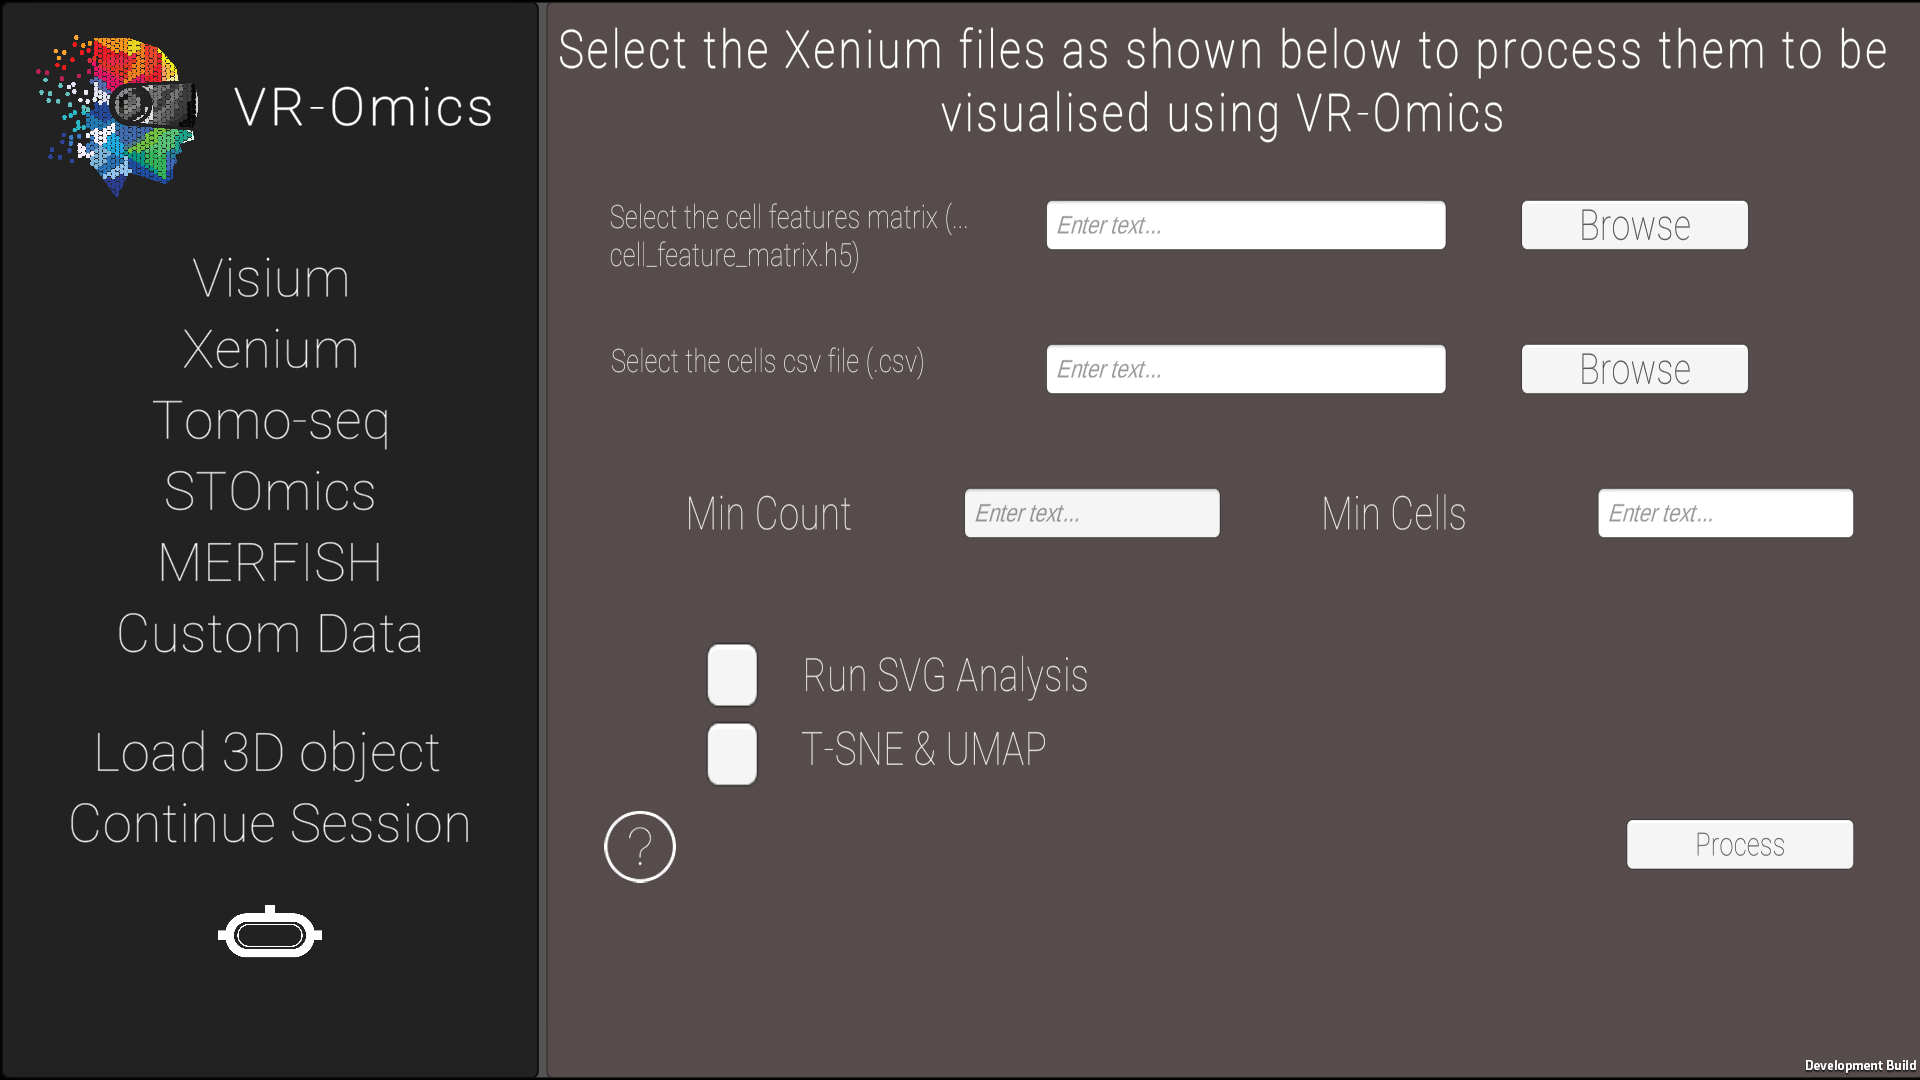
Only one public dataset was available during development of VR-Omics The dataset can be downloaded from 10X Genomics. |
| 3 | Confirm selection |
Click Process to process the data. The processed data will be saved in the VR-Omics directory. From the directory navigate to Select the whole folder containing Xenium for the Upload to the Visualiser |
The process step can take a couple of minutes depending on the size of the dataset and the computational power of the computer used. Once the data was processed this step can be skipped and the data can be visualised using the Xenium load option. The processed data will be saved in the VR-Omics data folder. To Visualise the data select the complete folder as shown in the figure.
|
Load
| 1 | Navigate to the Xenium load menu |
|
|
|---|---|---|---|
| 2 | Select the Xenium files |
Select the Xenium folder processed with the VR-Omics AW (highlighted in green in the picture) using Browse. |
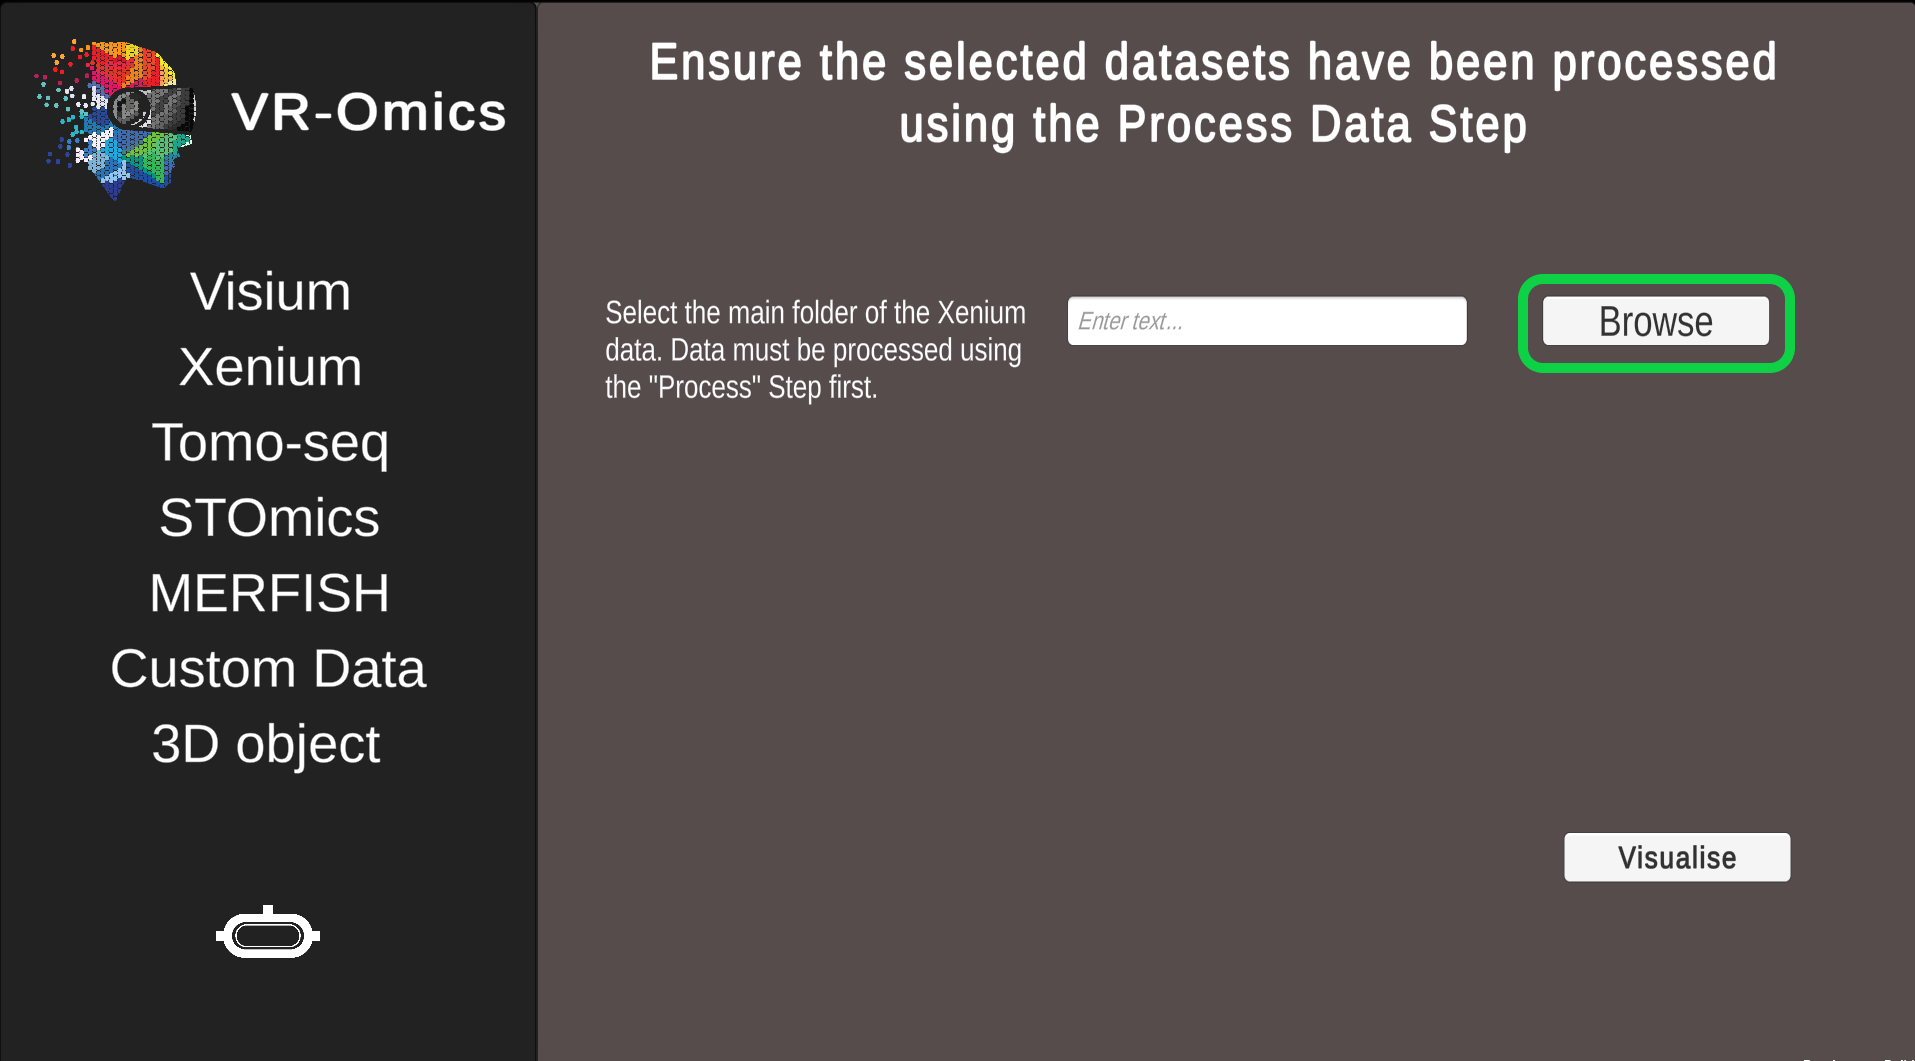
The data set can be found in the VR-Omics directory. Navigate from there to
Only one public dataset was available during development of VR-Omics The dataset can be downloaded from 10X Genomics. |
| 3 | Confirm selection |
Click Visualise to continue to the VR-Omics Visualiser.
|
Ensure the data has been processed before visualising it using the Process function. |
Tomo-Seq
Load
Load Tomo-Seq data
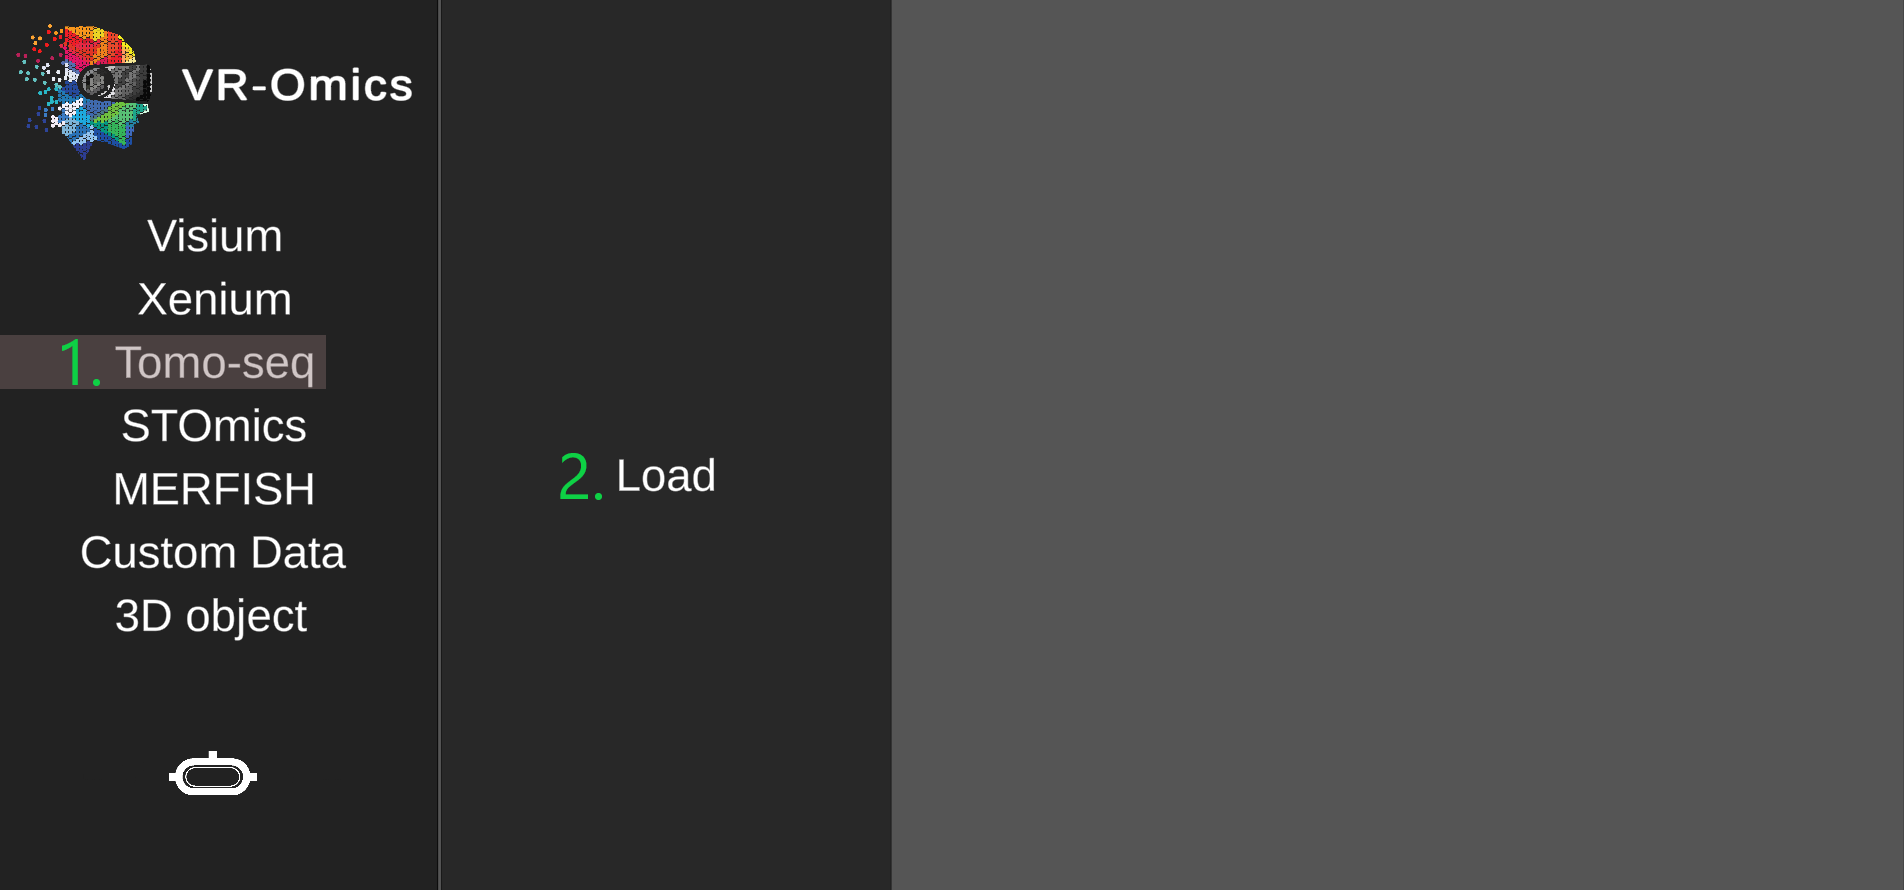
| 1 | Navigate to the Tomo-Seq load menu |
|
|
|---|---|---|---|
| 2 | Select the Tomo-Seq files |
.csv file in AP* cutting direction using Browse..csv file in VD* cutting direction using Browse..csv file in LR* cutting direction using Browse..txt files using Browse. |
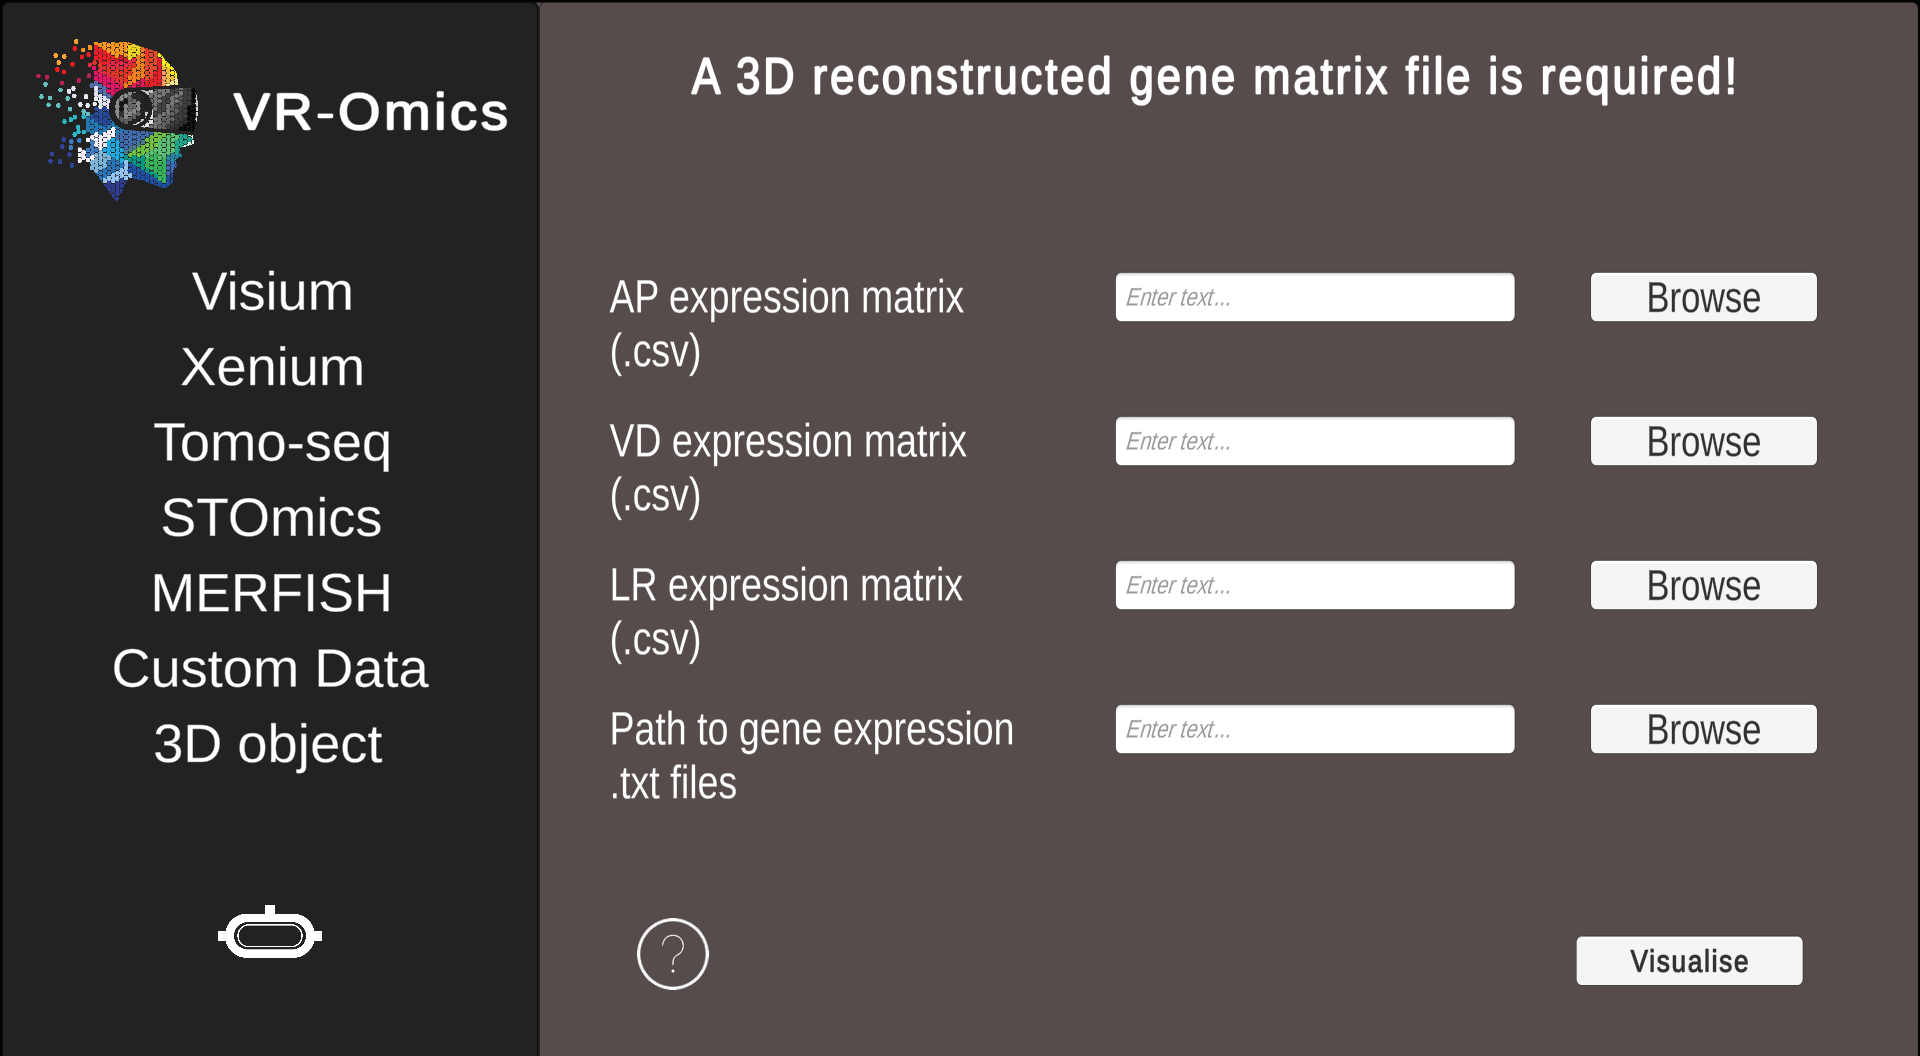
* AP = anterior to posterior, VD = ventral to dorsal, and LR = left to right The 3D reconstruction of the gene expression is explained in Asp et al. in Supplementary Data S2. |
STOmics
Process
Process STOmics data
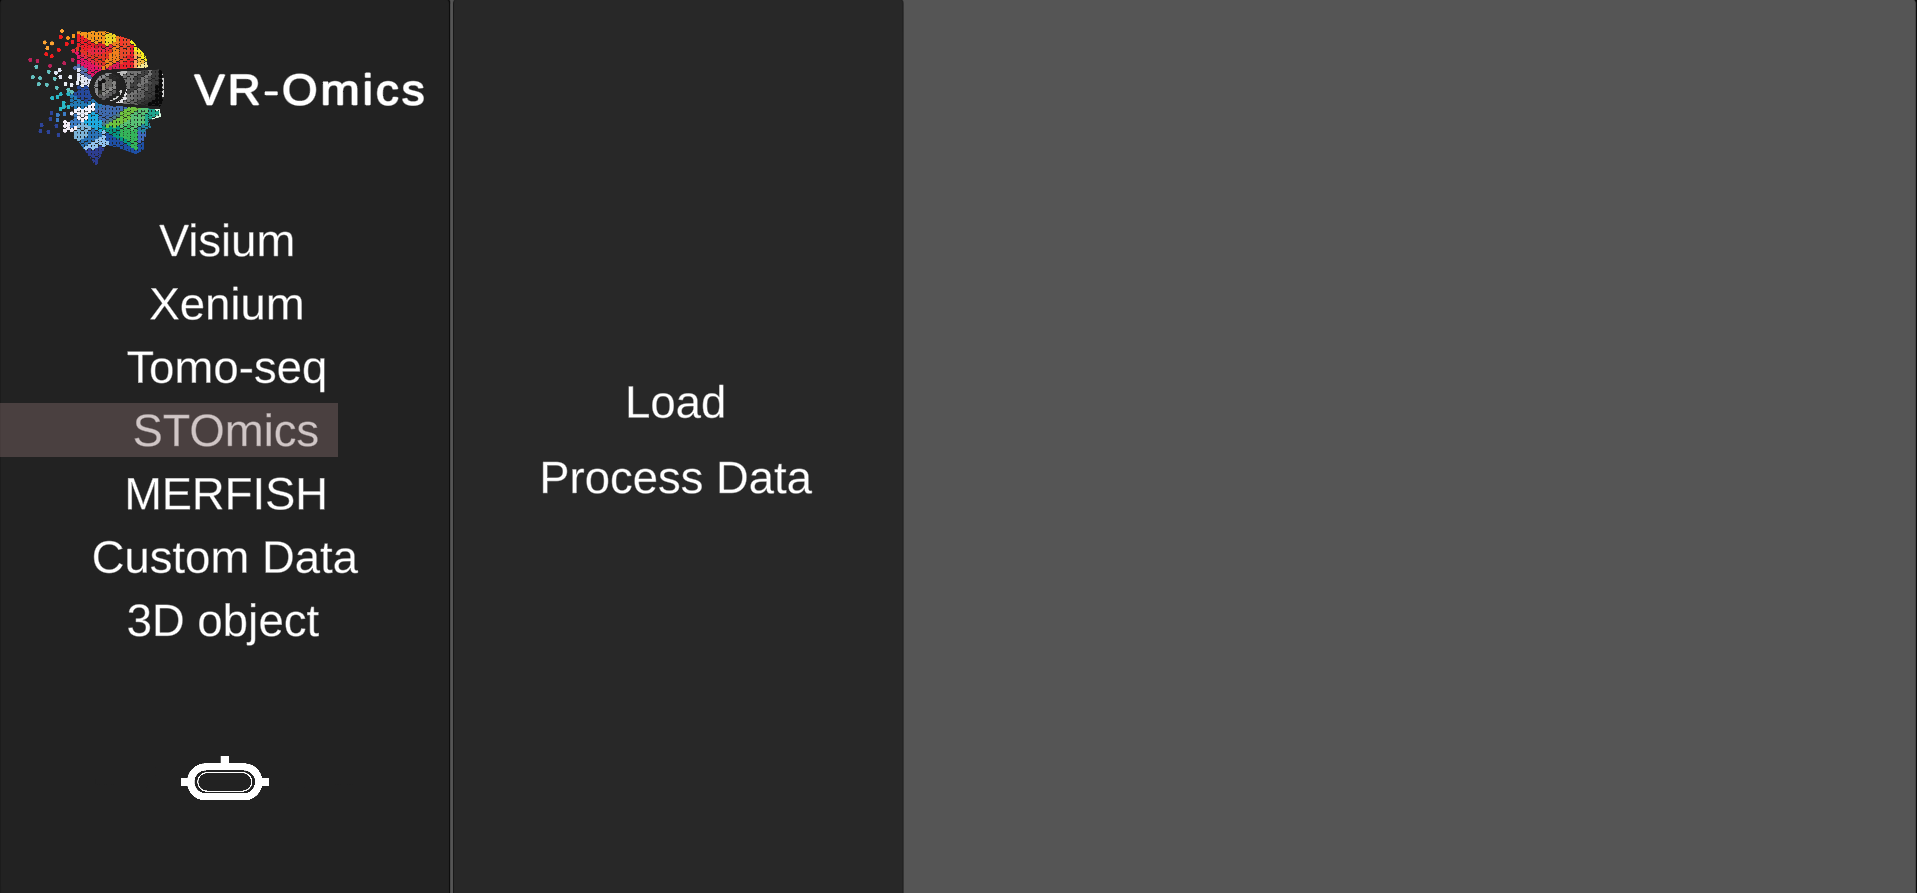
| 1 | Navigate to the STOmics process menu |
|
|
|---|---|---|---|
| 2 | Select the STOmics file |
Select the gene expression matrix |
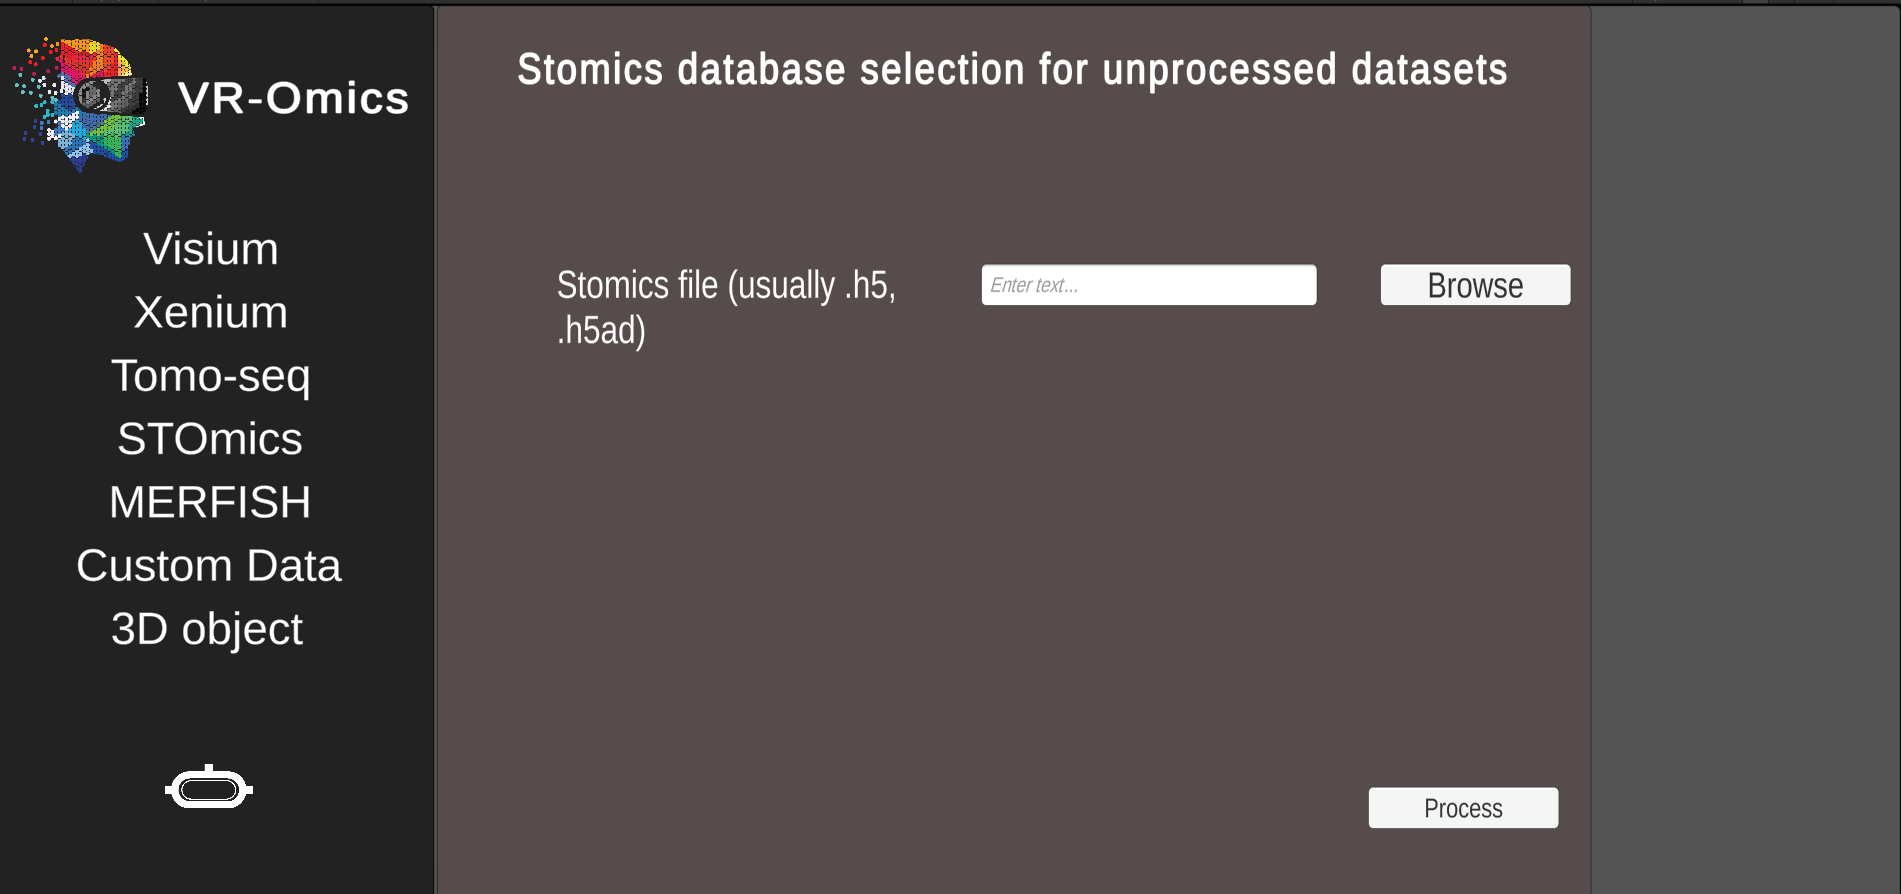
The dataset can be downloaded from STOmics Database. |
| 3 | Confirm selection |
Click Process to process the data. The processed data will be saved locally. |
The process step can take couple of minutes depending on the size of the dataset and the computational power of the machine. Once the data was processed this step can be skipped and the data can be visualised using the STOmics load option. The processed data will be saved in the VR-Omics data folder. To Visualise the data select the complete folder as shown in the figure.
|
Load
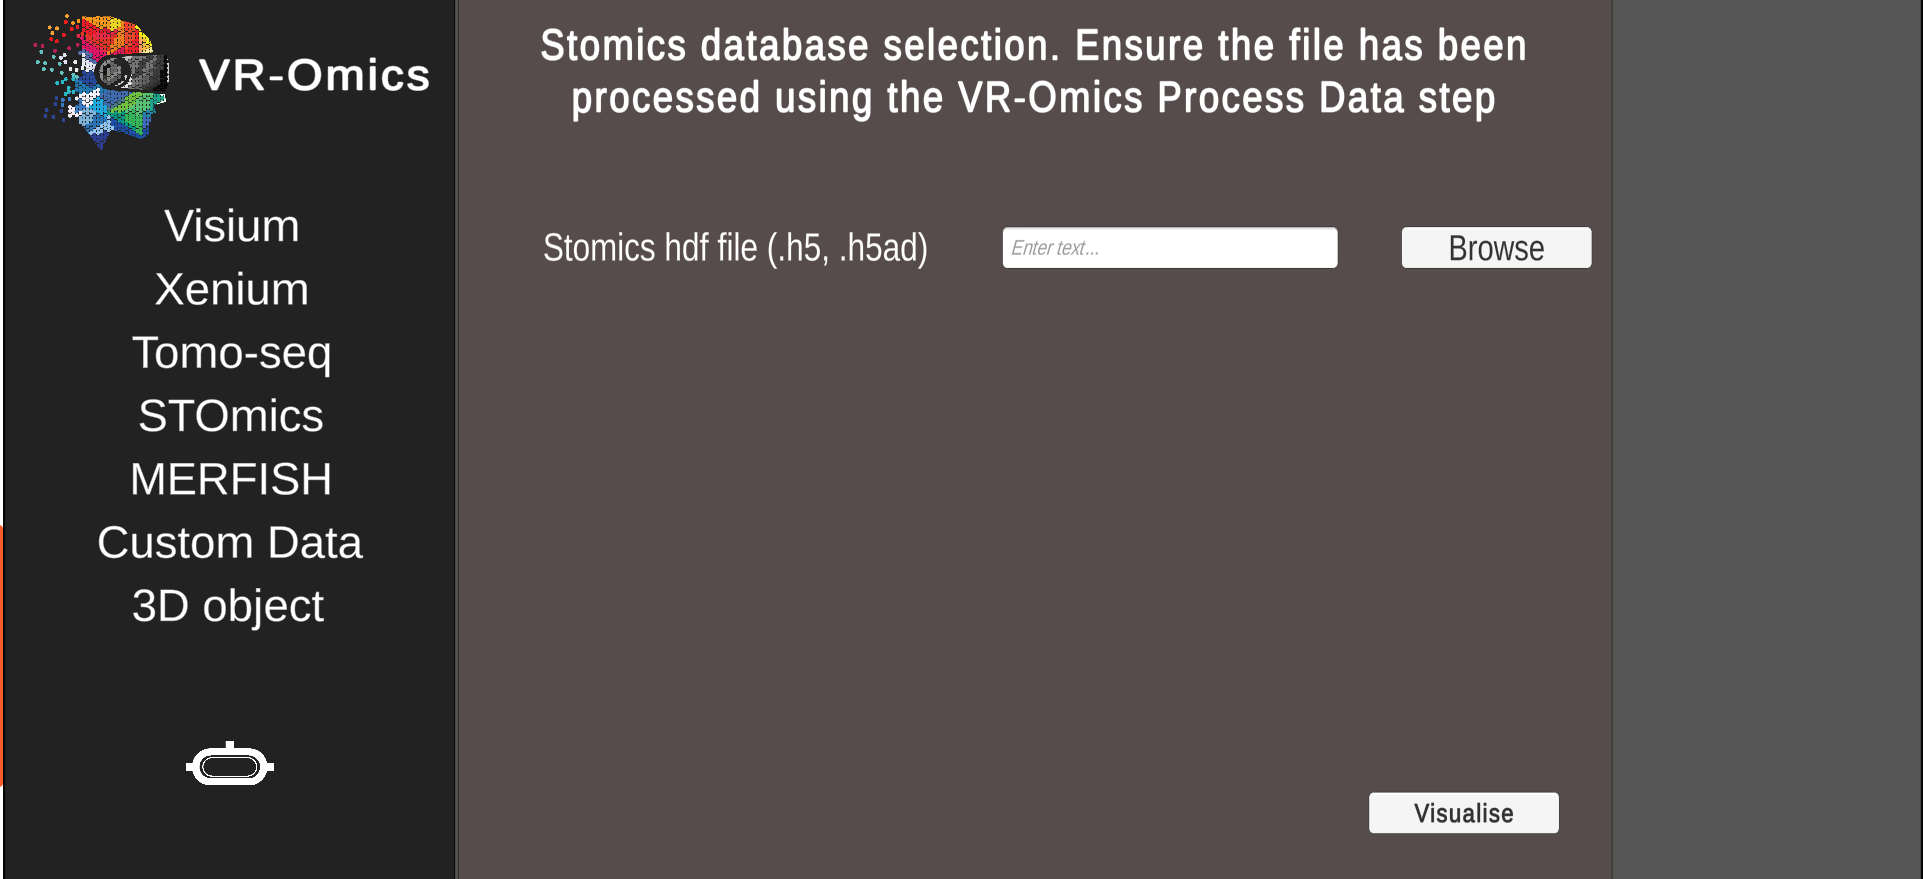
| 1 | Navigate to the STOmics load menu |
|
|
|---|---|---|---|
| 2 | Select the STOmics files |
Select the processed gene expression STOmics |
Ensure the data was processed using the Process function. The processed data can be found in the VR-Omics data folder. To Visualise the data select the complete folder as shown in the figure.
|
MERFISH
Process
| 1 | Navigate to the MERFISH process menu |
|

|
|---|---|---|---|
| 2 | Select the MERFISH files |
.csv using Browse.csv file using Browse.csv file using BrowseRun Full Analysis toggle to include spatial analysis (Moran Results) |
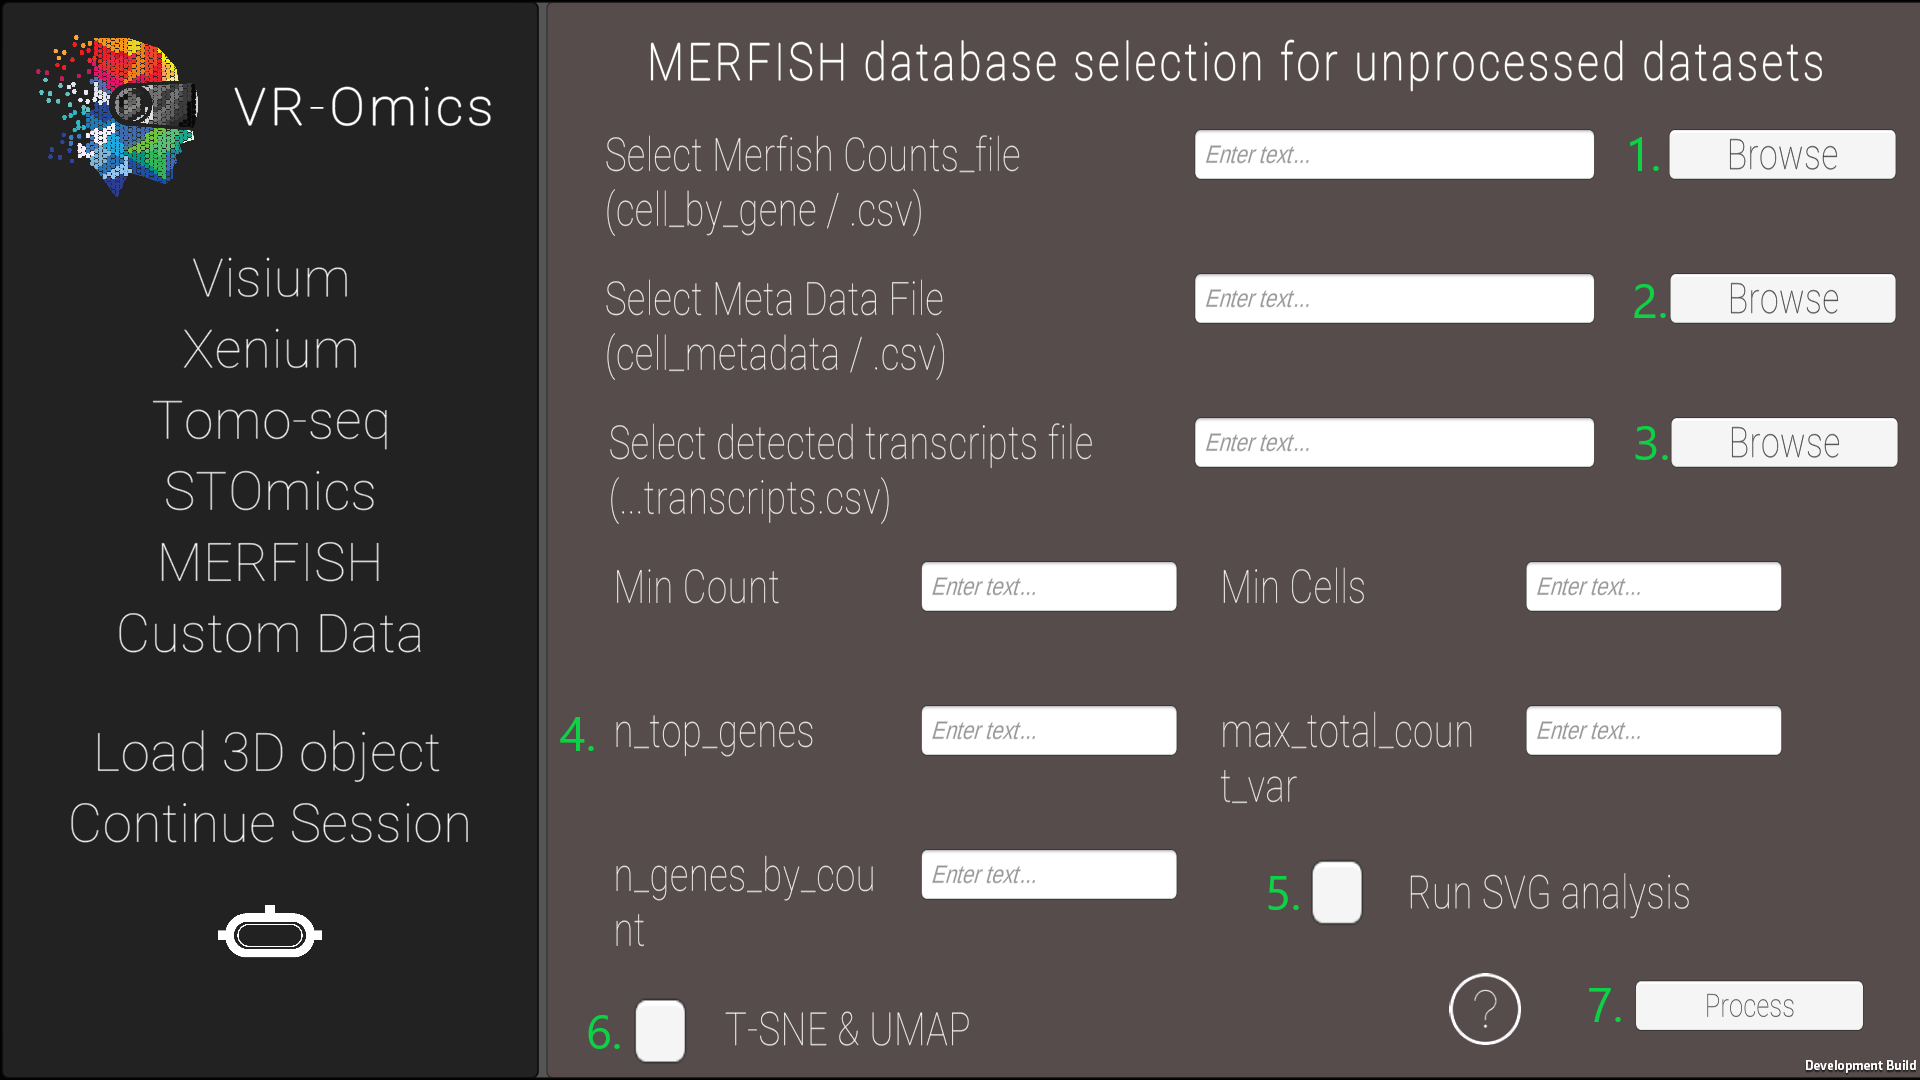
The MERFISH data we used is from Vizgen, where there data is publicly available under their data release program. The processed data will be saved in the VR-Omics data folder. To Visualise the data select the complete folder as shown in the figure.
|
Load
| 1 | Navigate to the MERFISH load menu |
|
|
|---|---|---|---|
| 2 | Select the MERFISH files |
|
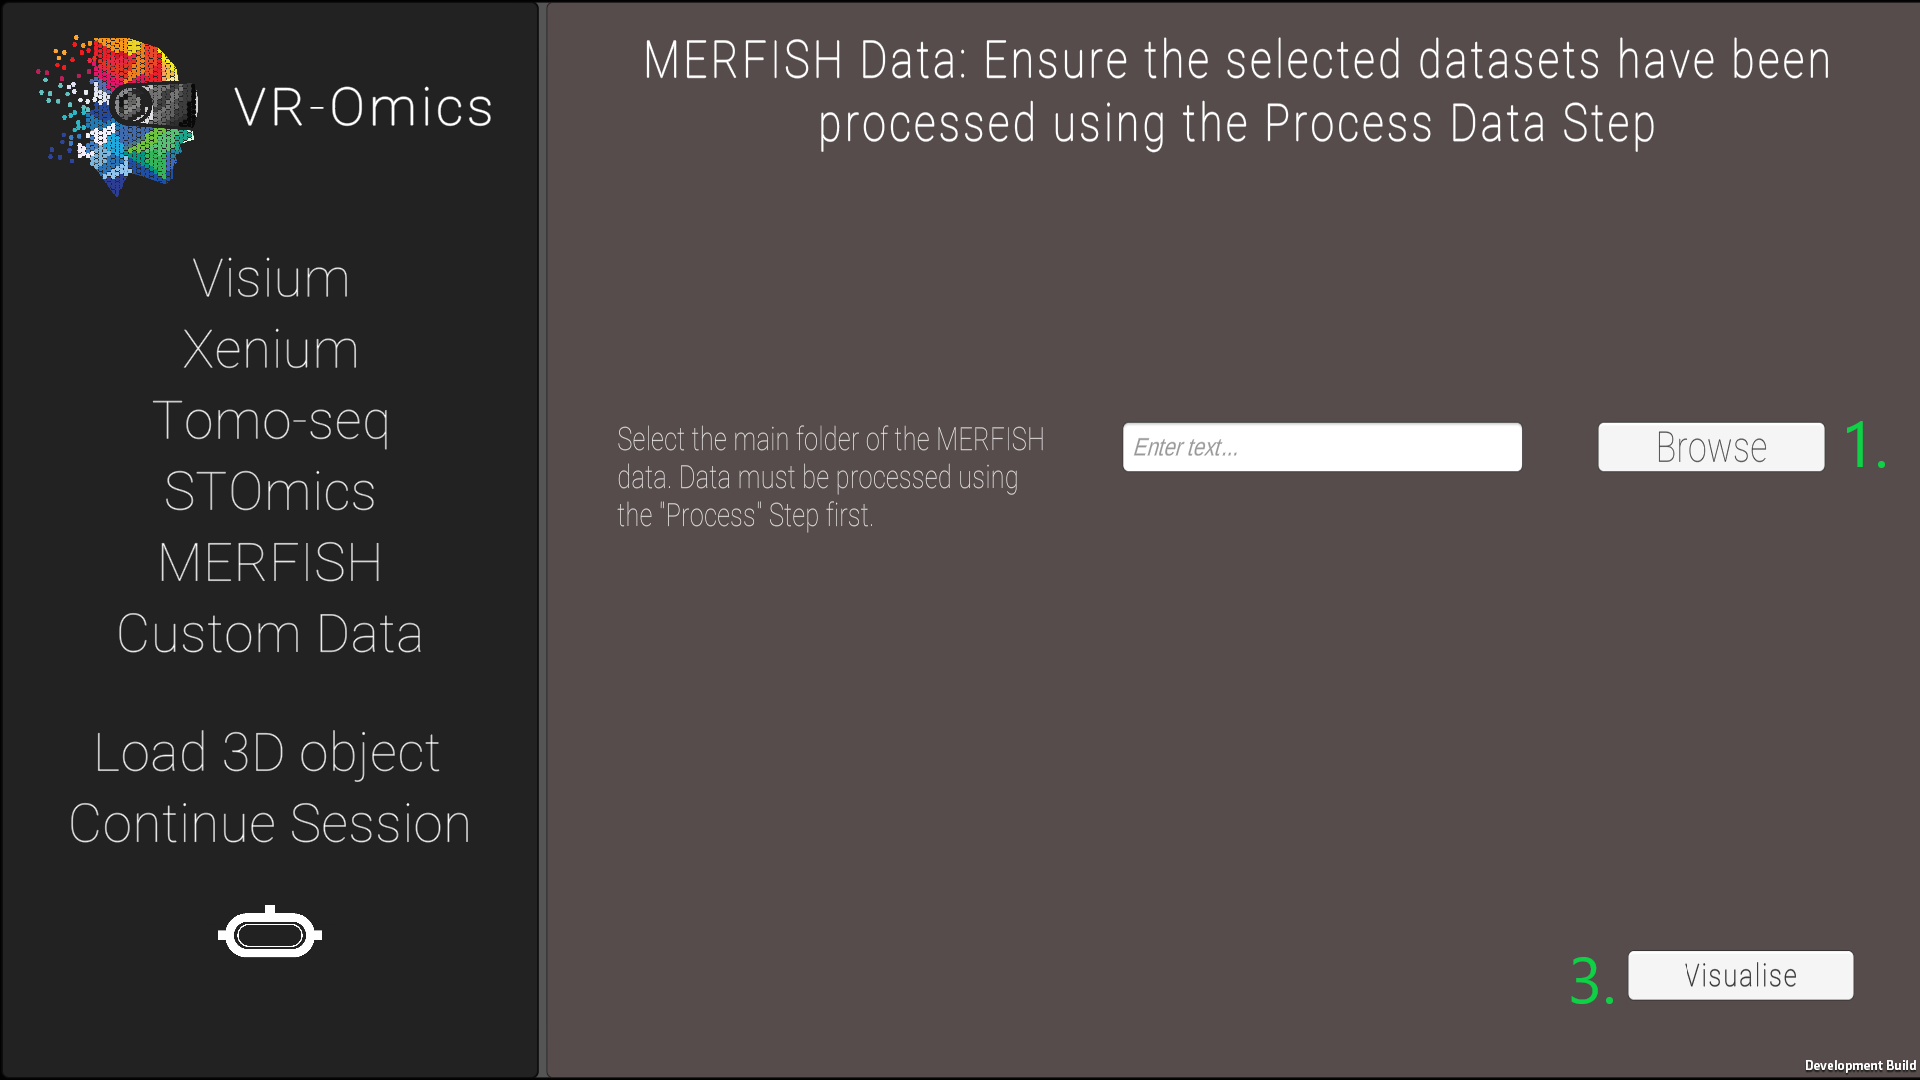
The processed data can be found in the VR-Omics data folder. To Visualise the data select the complete folder as shown in the figure.
The MERFISH data used was provided by Vizgen where there data is publicly available under their data release program. |
Custom data
Load
| 1 | Navigate to the Custom data load menu |
|
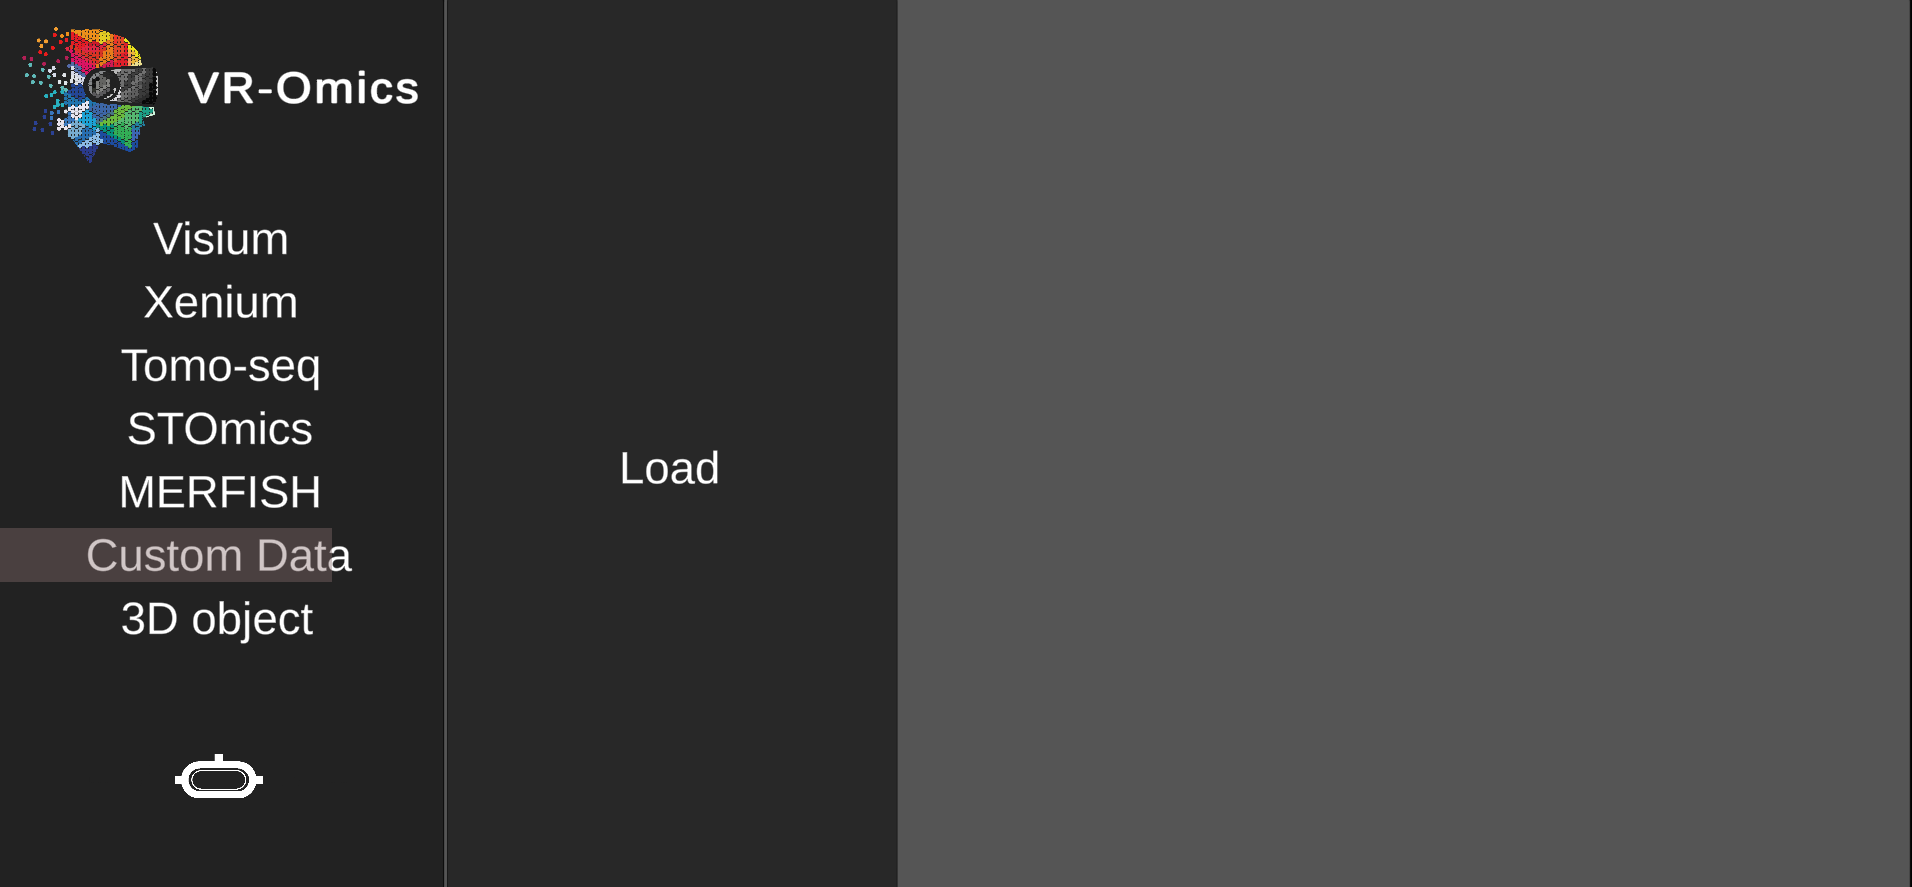
|
|---|---|---|---|
| 2 | Select the Custom data files |
.csv file using Browse.csv file using Browse |
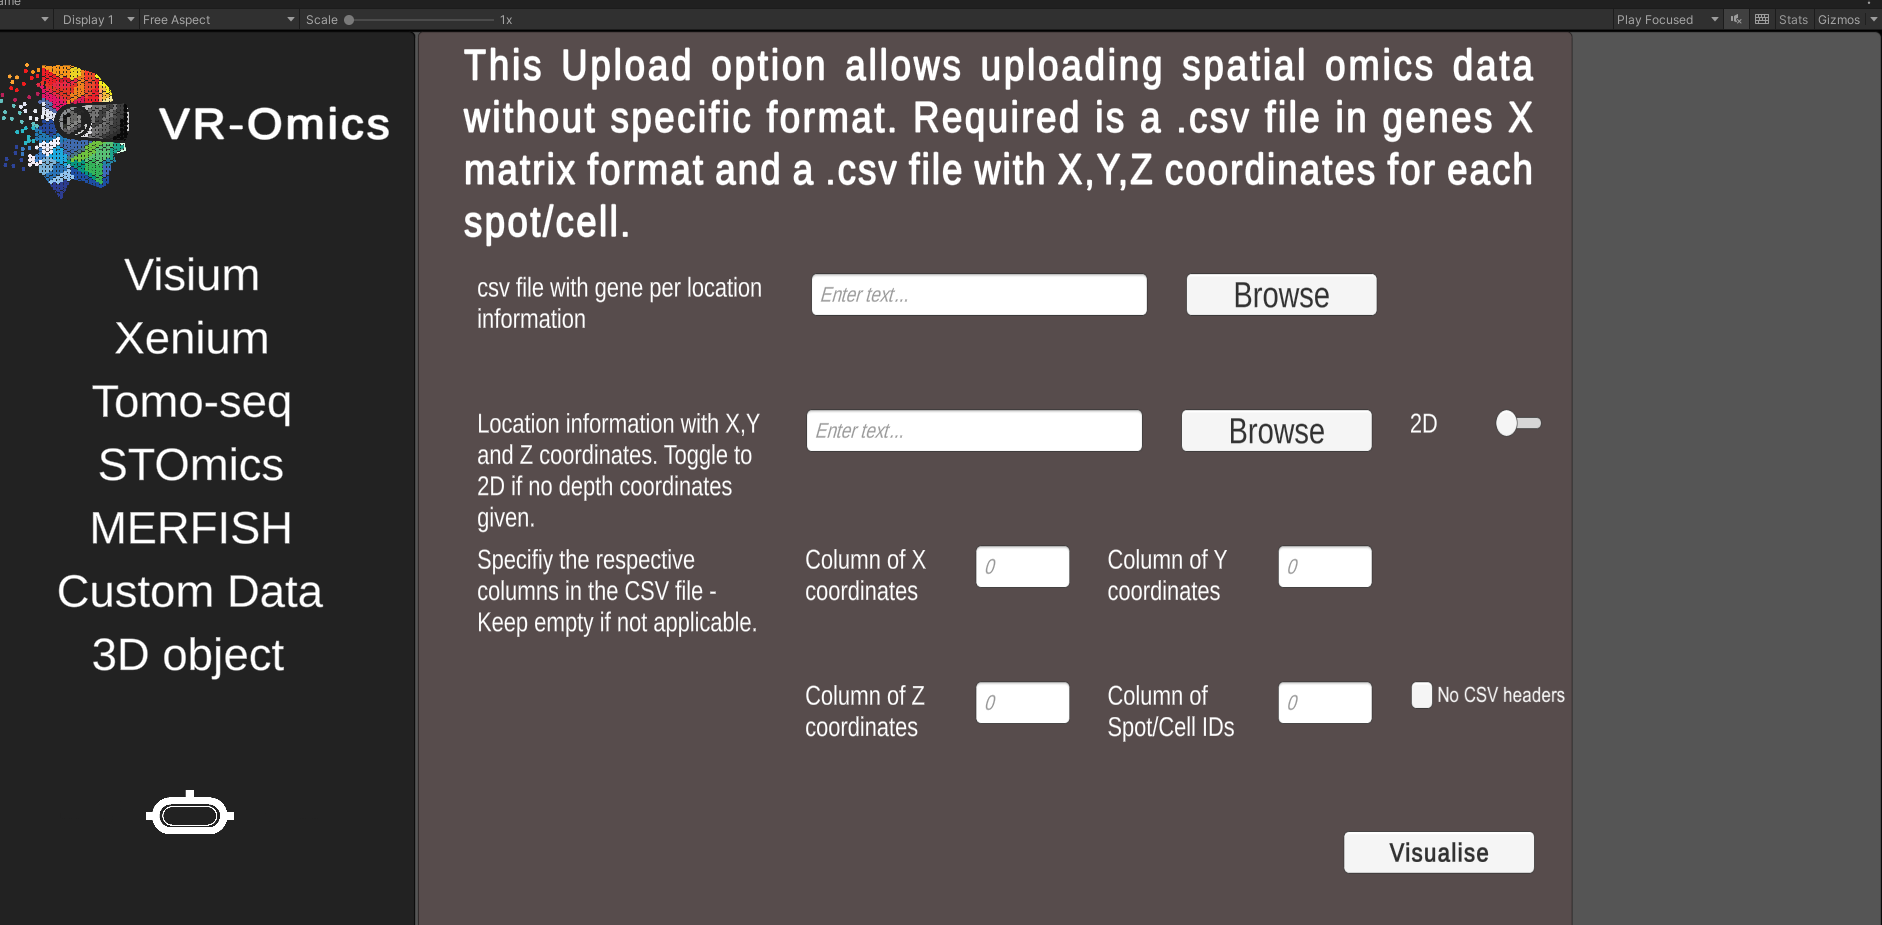
* Ensure the data is stored in a gene per location data file using columns for locations and rows for gene expressions ** The meta data file stores the X,Y and optional Z coordinates of the dataset. Each row needs to represent one location where the locations need to be in same order as in the gene expression file. |
| 3 | Specify columns |
0 for the second column enter 1 etc.0 for the second column enter 1 etc.0 for the second column enter 1 etc.*0 for the second column enter 1 etc.** |
* Leave blank if no three dimensional dataset ** Leave blank if no IDs available *** The header is the first row in a csv file usually used to store the headers of each column. |
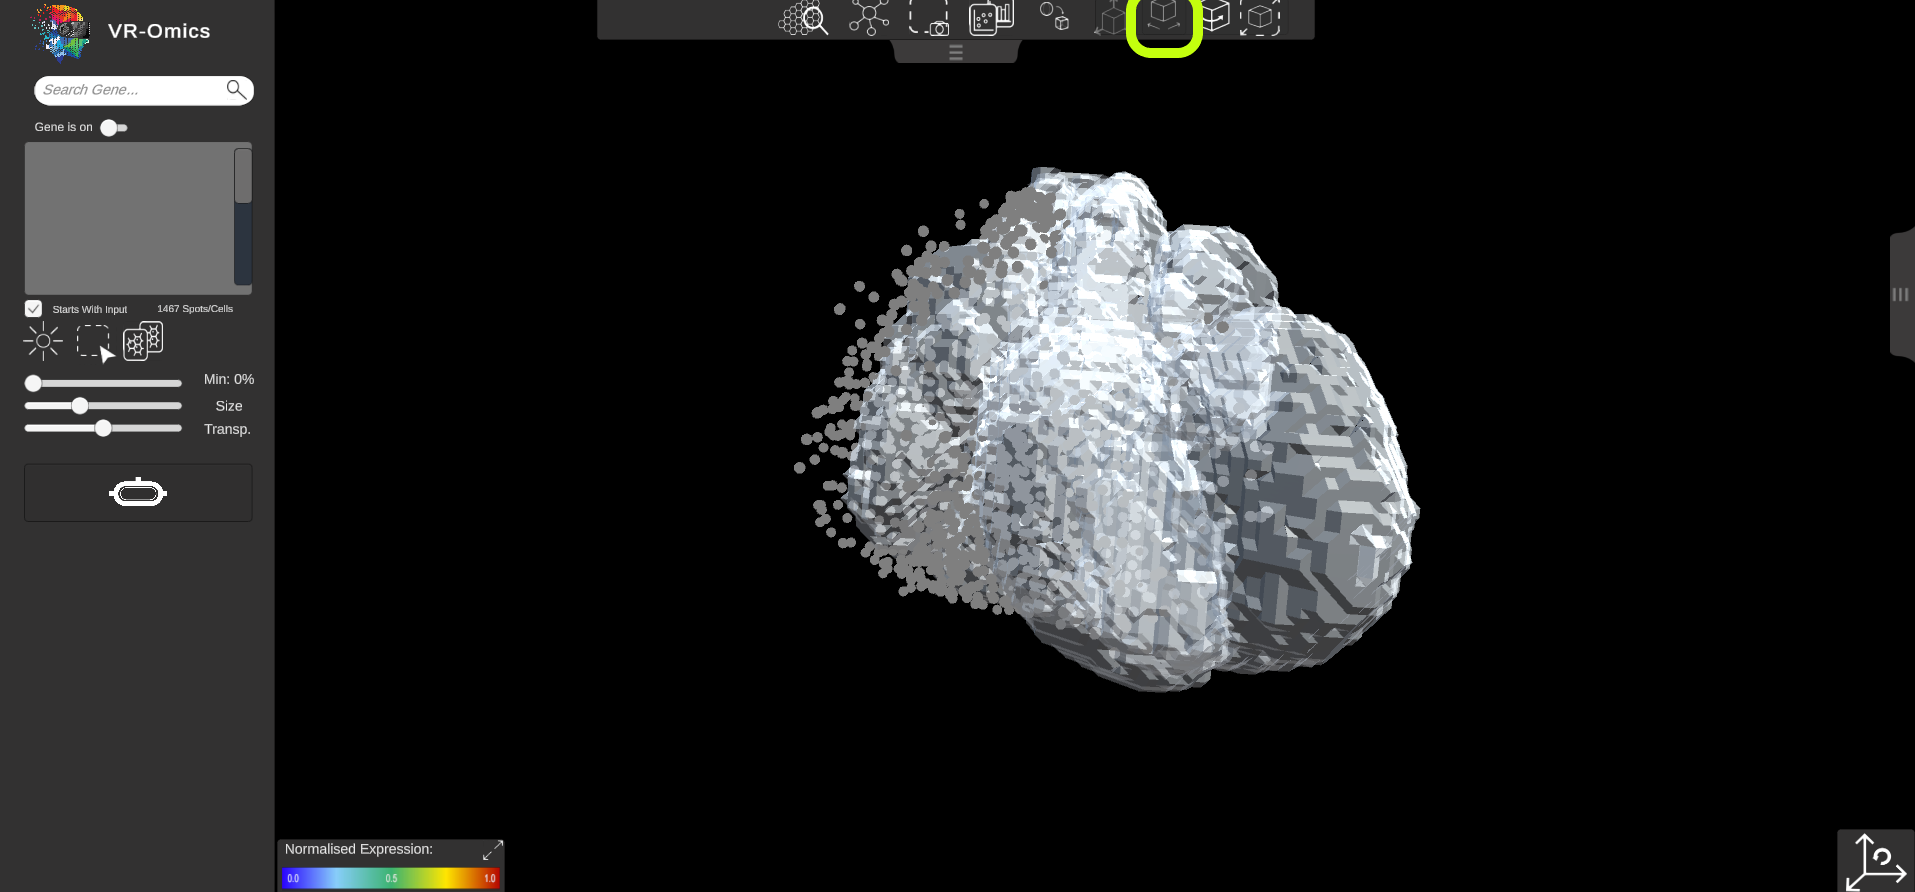
3D Object
Load
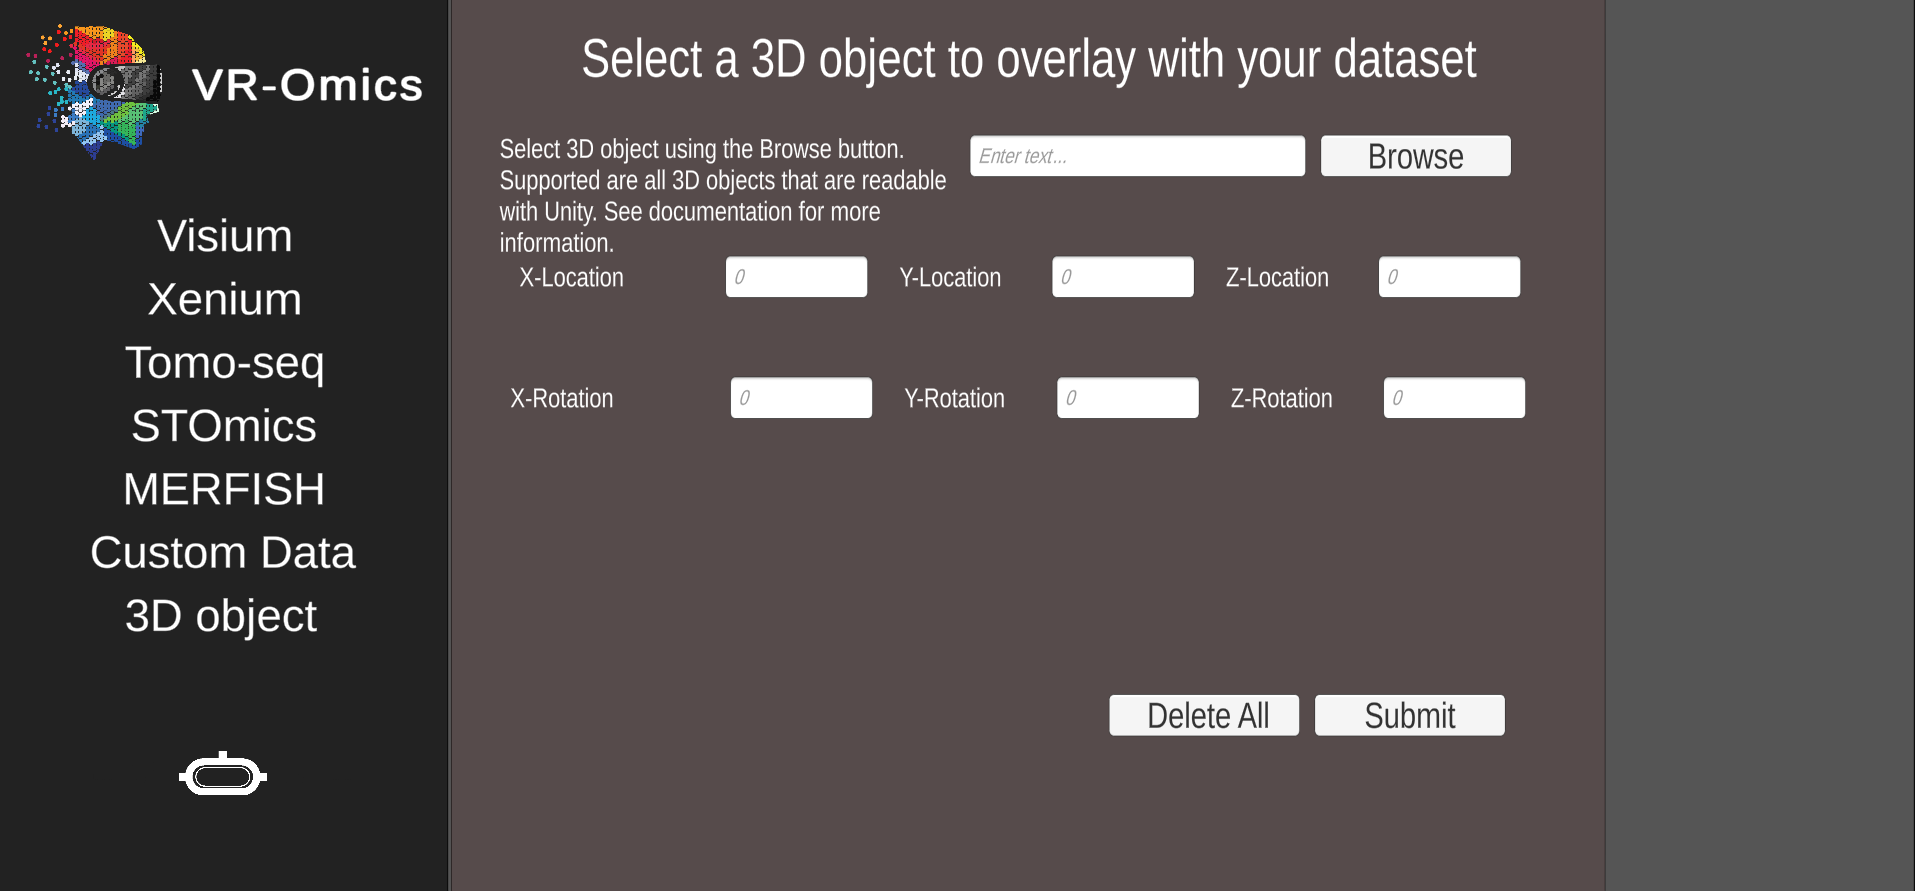
| 1 | Navigate to the 3D object menu |
From the main menu select 3D object |
|
|---|---|---|---|
| 2 | Select the 3D object file |
|
* Only 3D object supported by Unity can be uploaded. More information can be found using the Unity documentation. This feature was tested with ** The coordinates are relative to the dataset, the dataset will always be rendered in the origin *** The rotation is relative to the dataset, the dataset will always be rendered in the origin Ensure the 3D object has the right measurements, the object can be resized within the VR-Omics Visualiser but if the object was uploaded top big, or too small compared to the rendered dataset this might lead to issues. In this case please adapt the dimensions of the object prior. |
| 3 | Submit the object |
Store the selected 3D object by clicking Submit |
Ensure the object was submitted before uploading a spatial dataset. This can't be done after entering the VR-Omics Visualiser. |
| 4 | Removing an object |
Remove all selected objects from the selection using Delete All |
Multiple objects can be uploaded, although this feature is only tested with one object. |
VR-Omics Visualisation
Gene Search Features
| Feature | Description | Icon | Image |
|---|---|---|---|
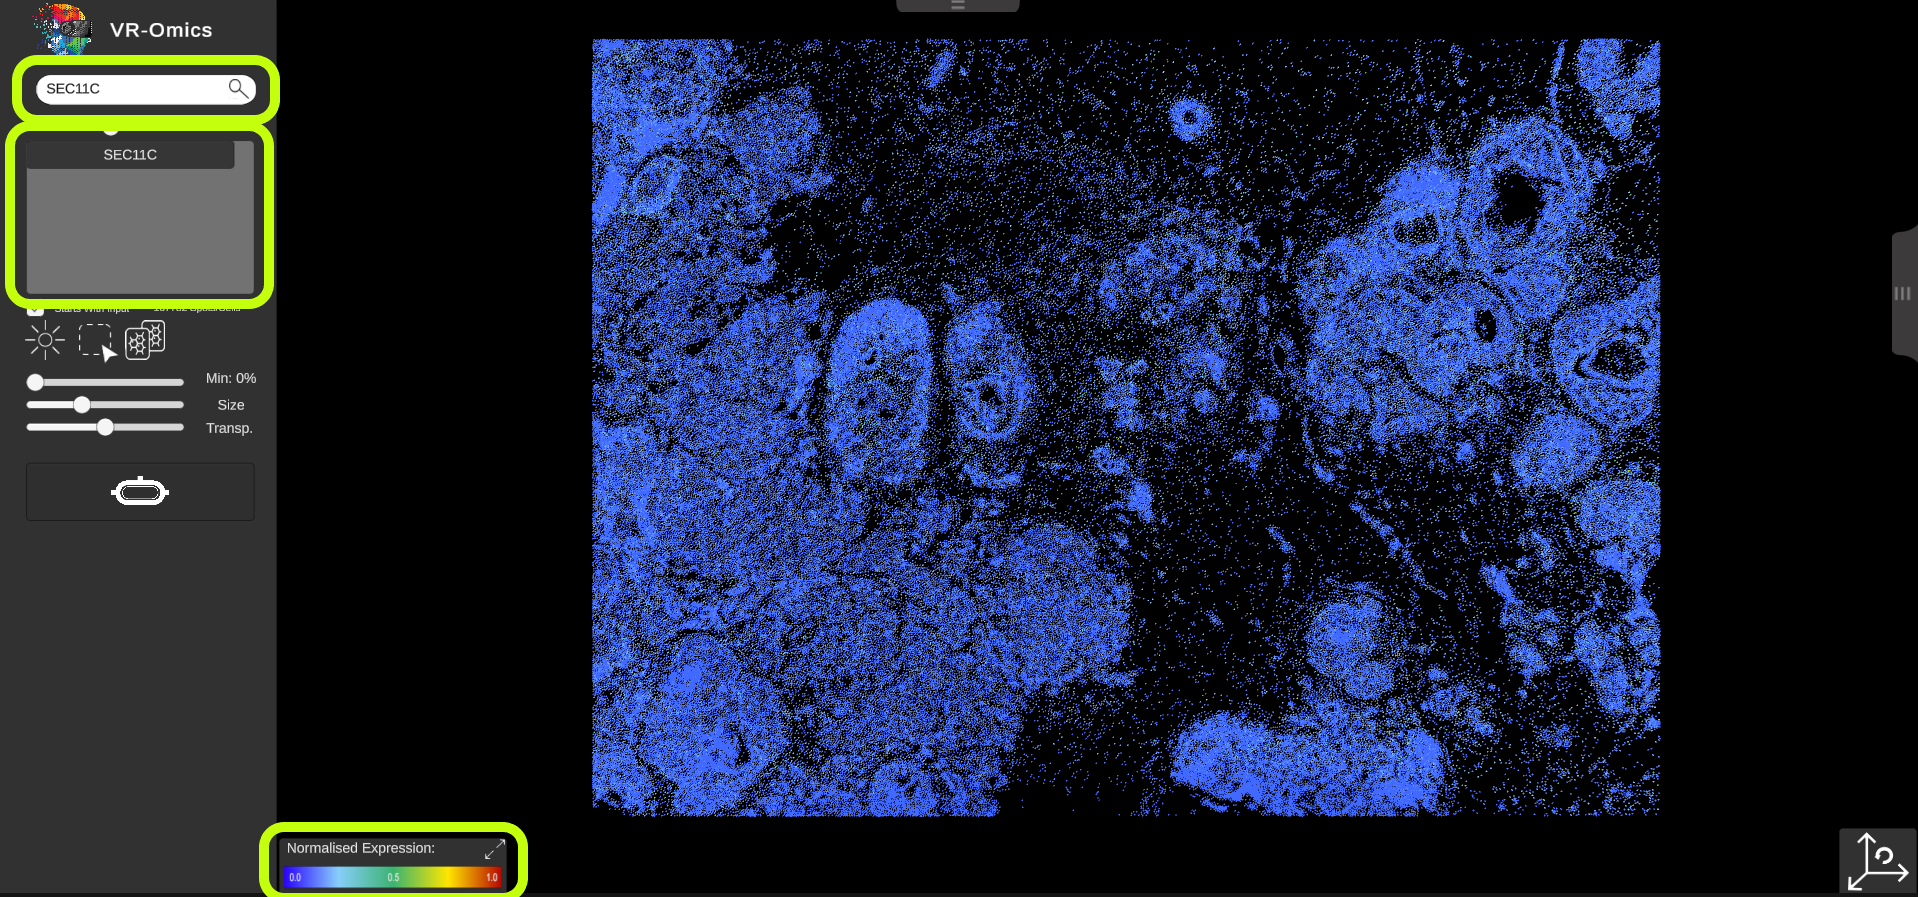
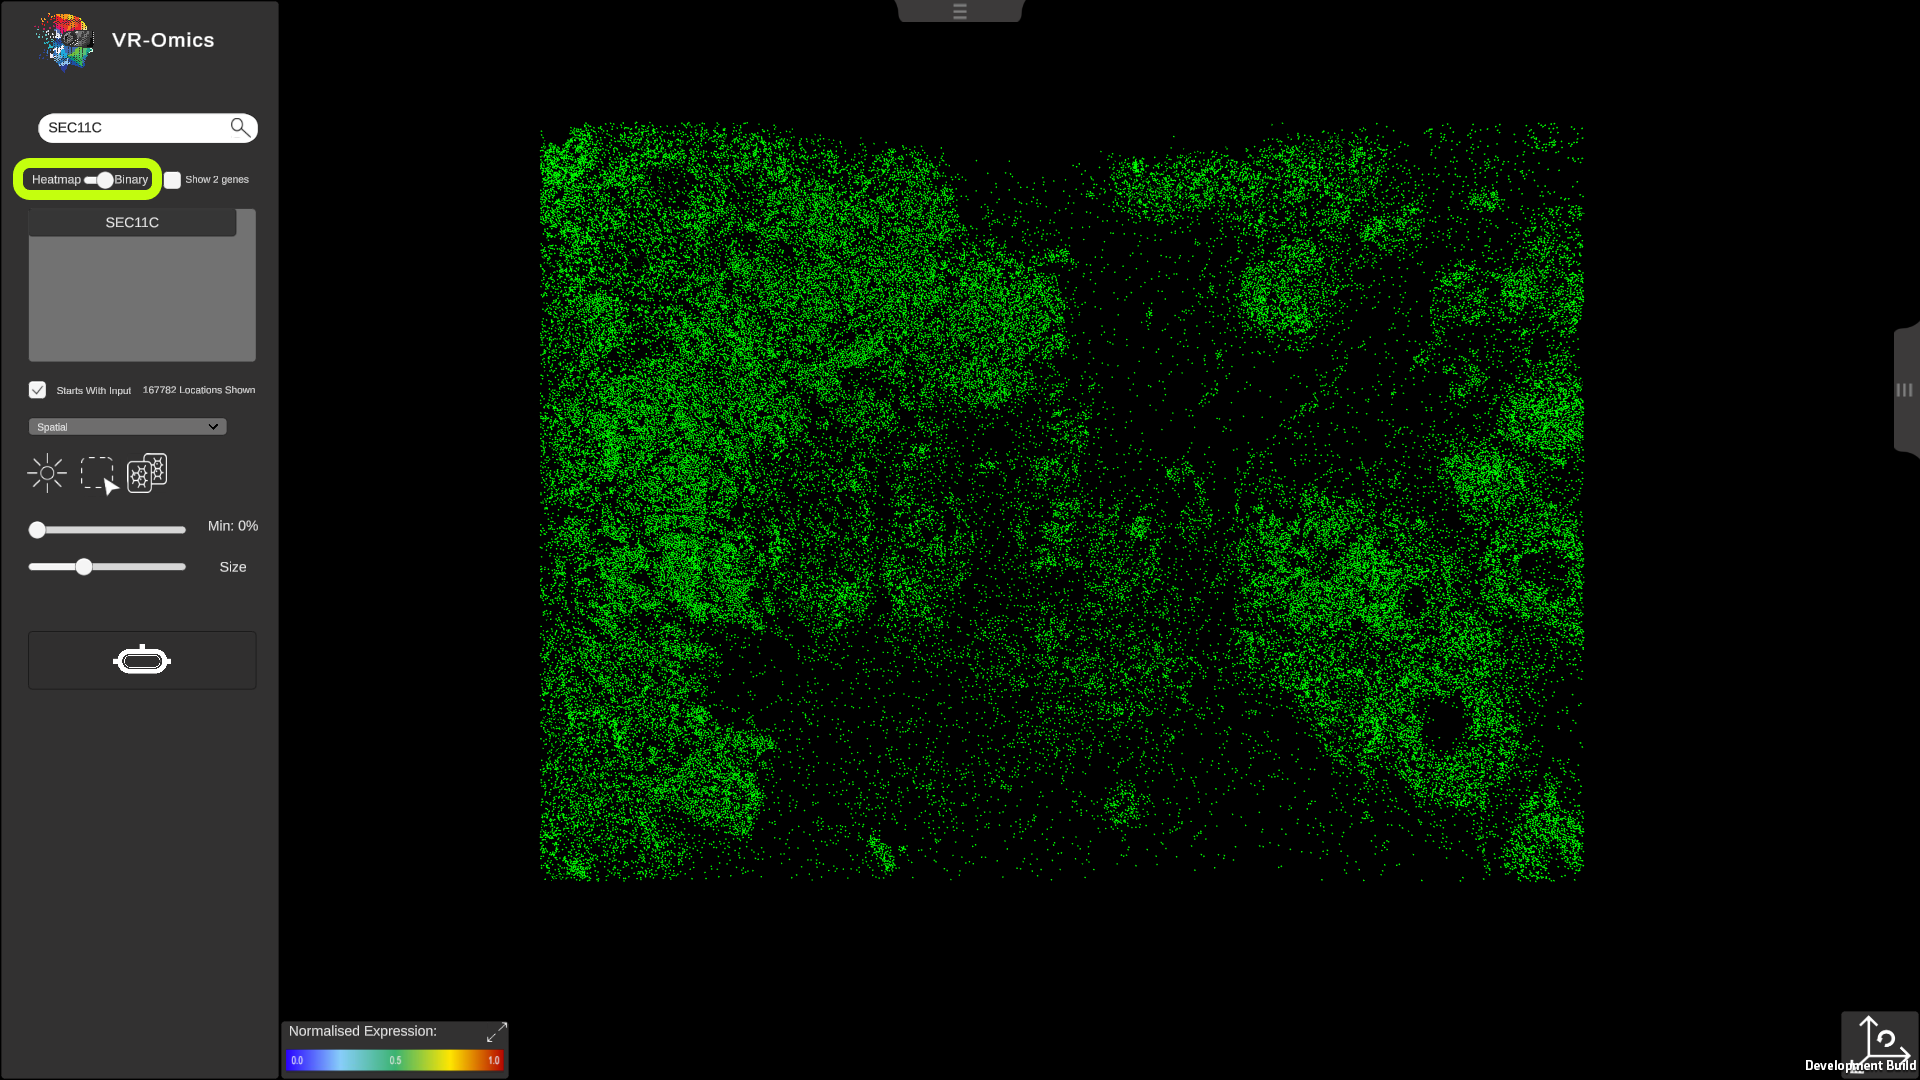
| Gene search - Heatmap
Visium Xenium STOmics Merfish Tomo-Seq Custom VR Demo |
To search for a gene (heatmap) using the search bar:
|
|
|
| Binary search - Gene is on
Visium Xenium STOmics Merfish Custom VR Demo |
To search for a gene (gene is on) using the search bar:
|
|
|
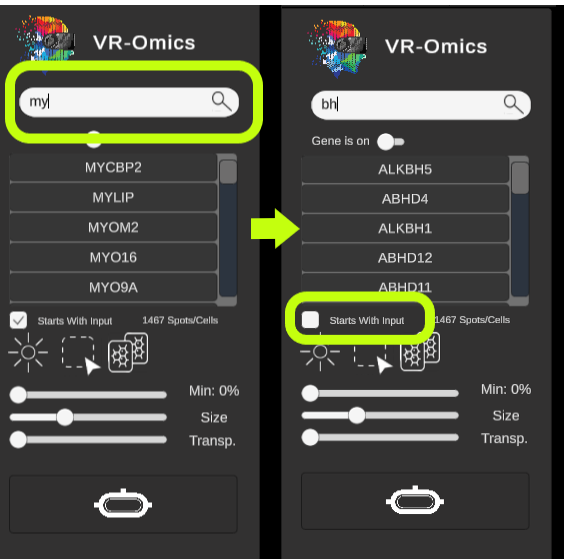
| Change if gene search contains or starts with term
Visium Xenium STOmics Merfish Tomo-Seq Custom VR Demo |
By default, gene names entered into the search bar will only return results that start with the input. To also include gene names that contain the input, uncheck the
|
|
|
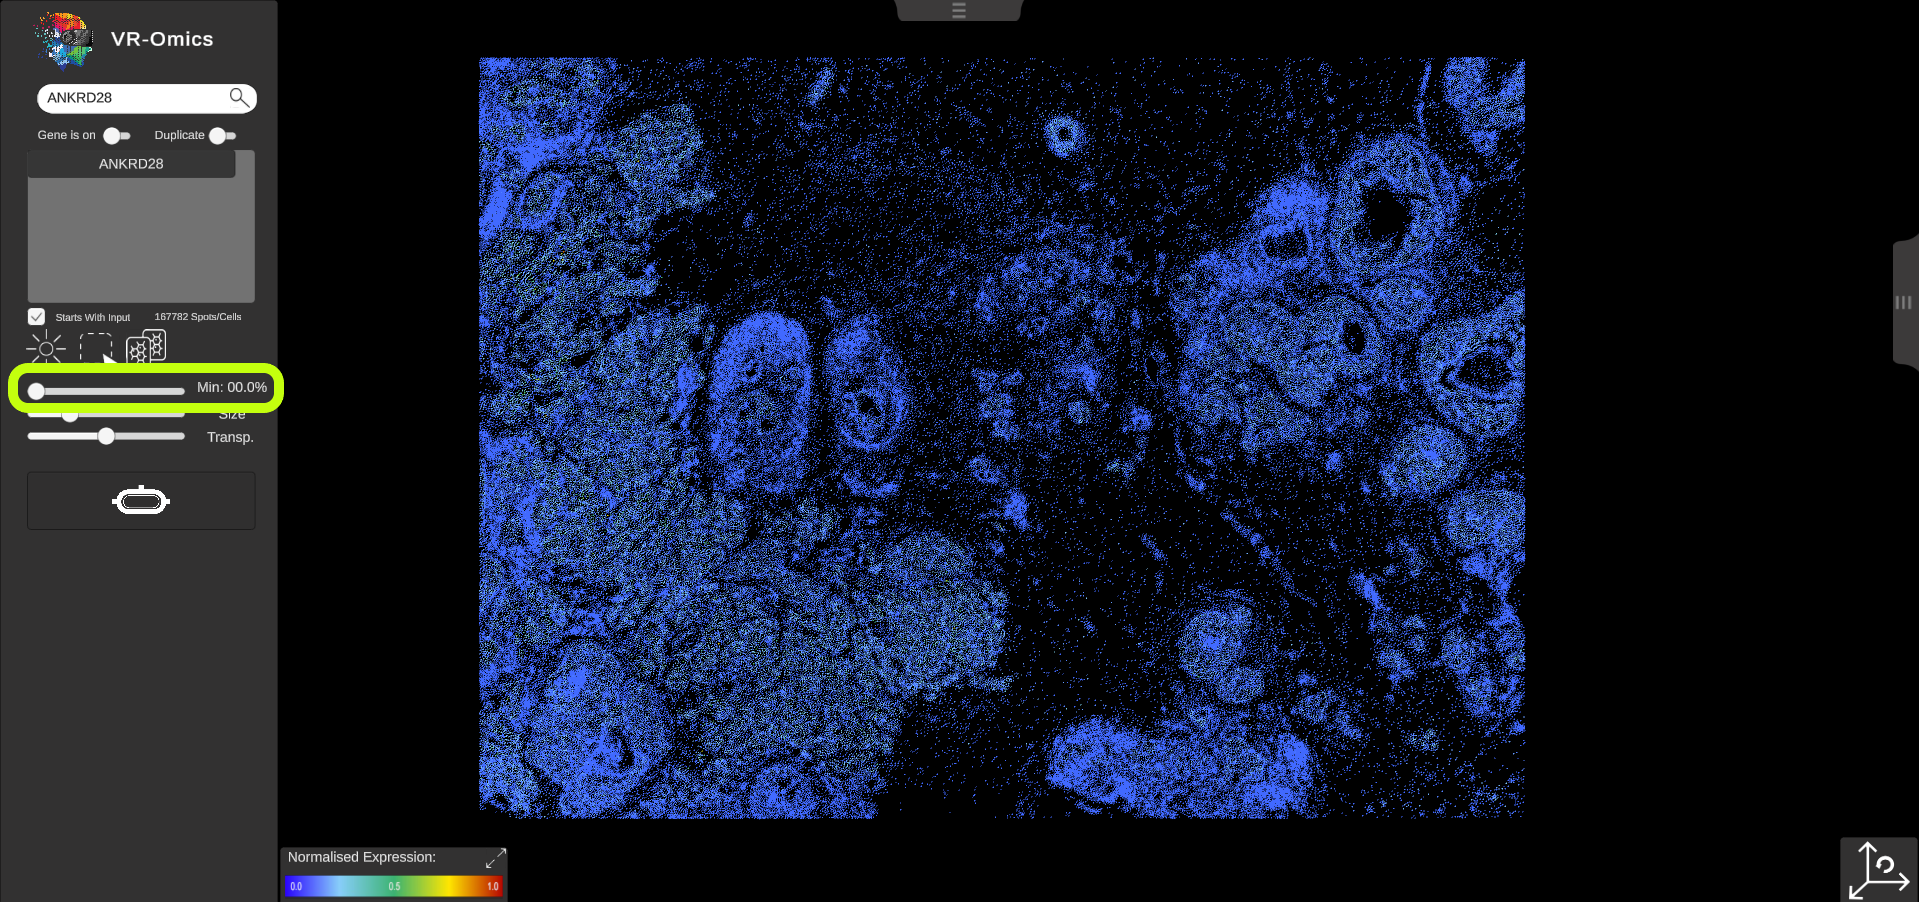
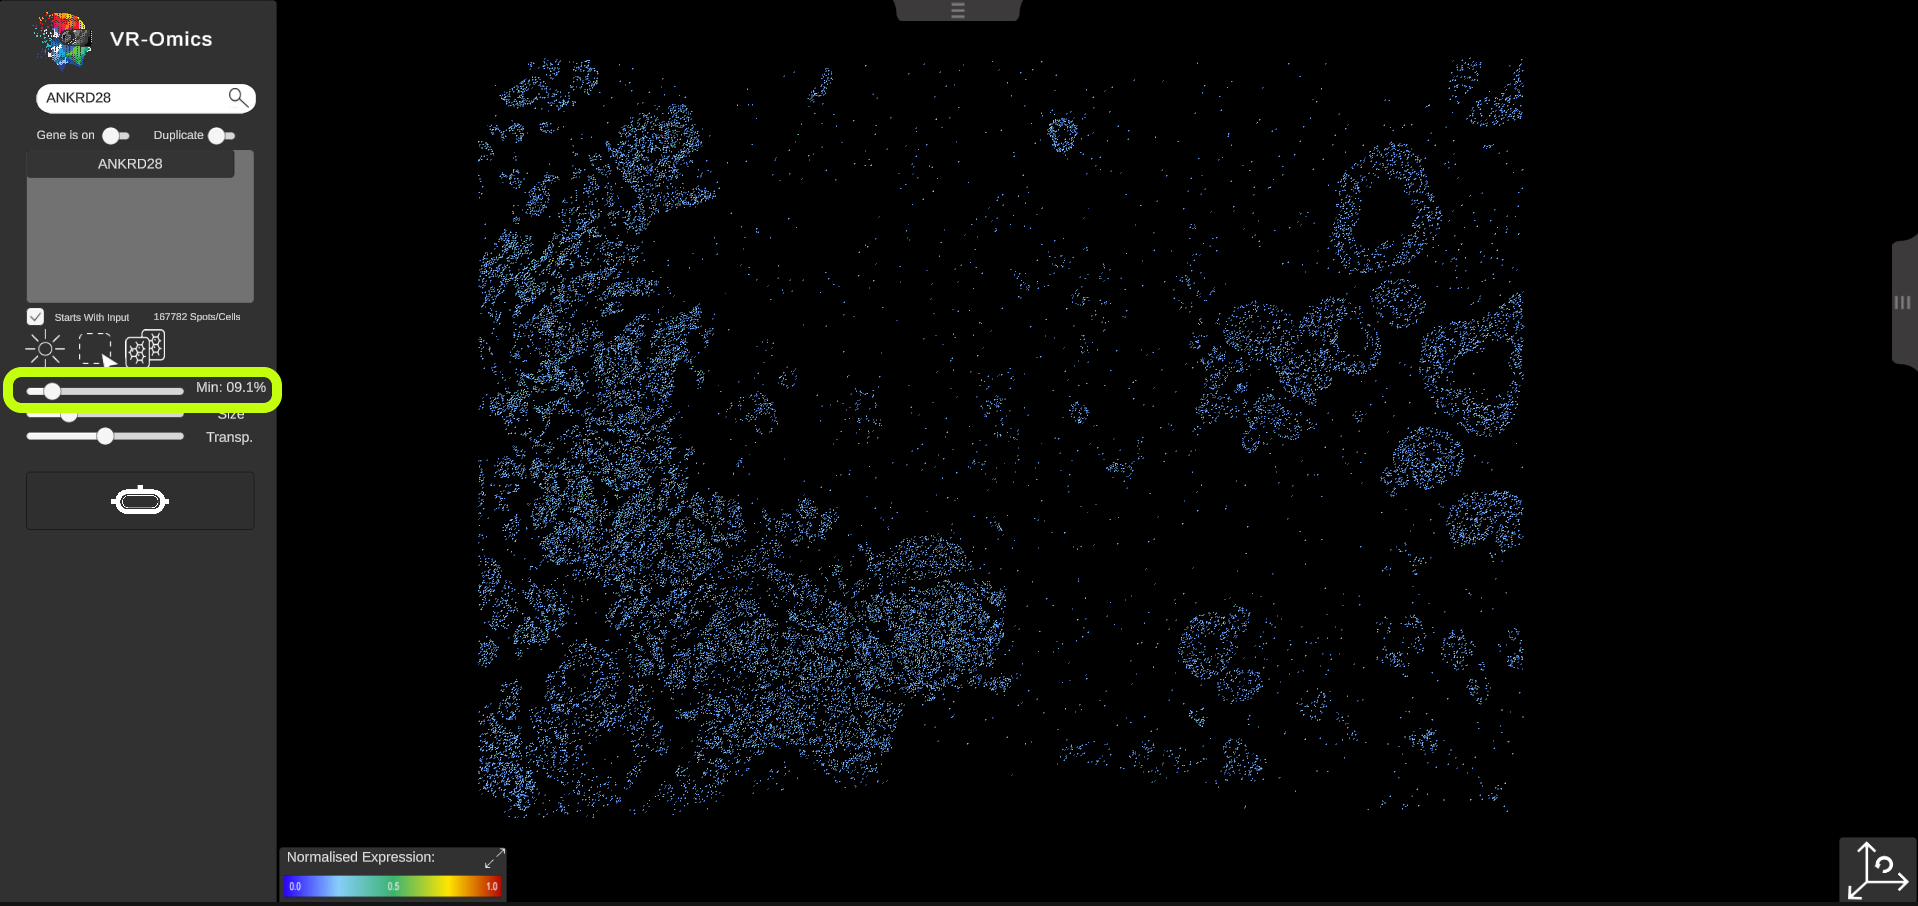
| Threshold - Minimum
Visium Xenium STOmics Tomo-Seq Merfish Custom VR Demo |
By default, each location in the dataset is coloured according to the normalised gene expression values. If no value is found for a location, the location will be cleared. The threshold slider is set to 0% by default, which means that all locations with an expression value of 0 or Lower of the normalised values will be visualised. To focus on regions with a Low expression level of the gene, you can adjust the slider to a Lower position:
|
|
|
Location Interaction Features
| Feature | Description | Icon | Image |
|---|---|---|---|
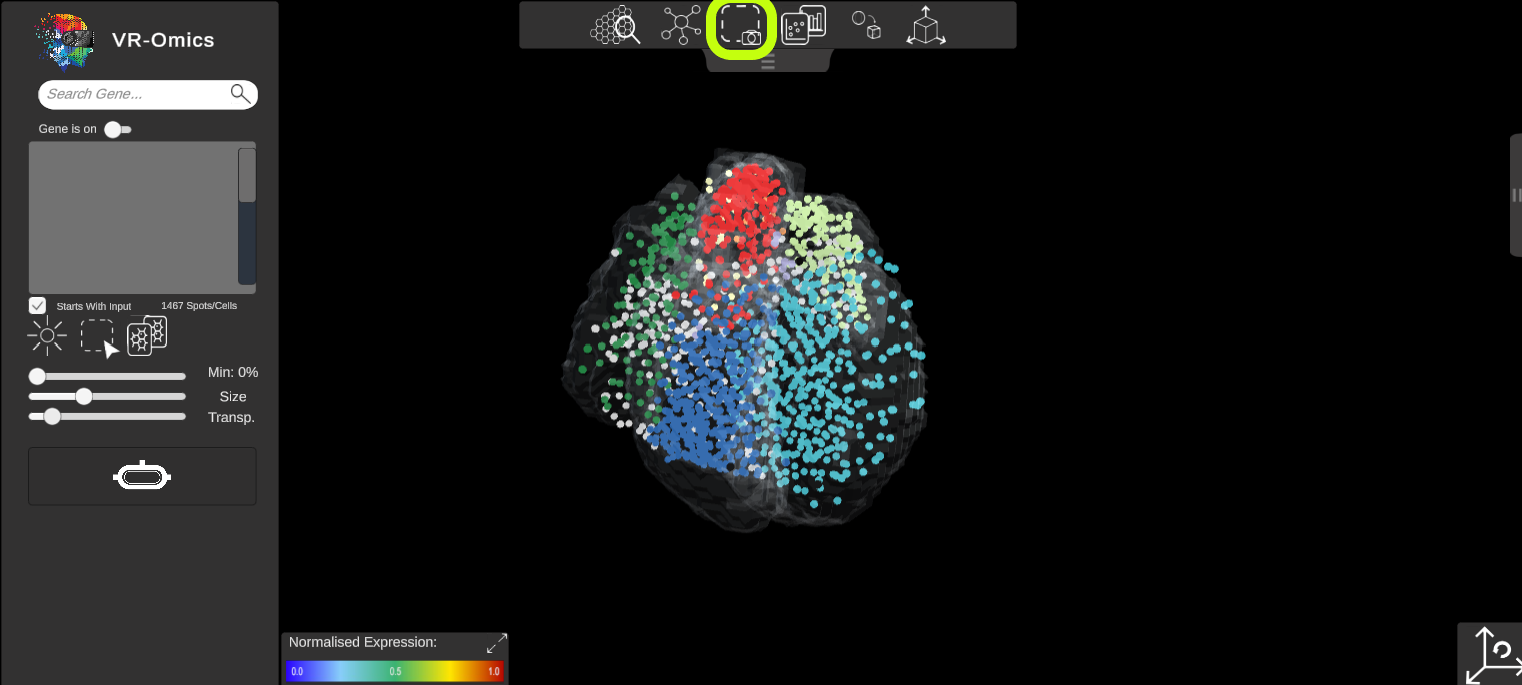
| Selecting Regions of Interest (ROI)
Visium Xenium STOmics Merfish Custom VR Demo |
ROIs can be selected by using the selection tool. To select a group of ROIs:
|
|
|
| Remove a single location
Visium Xenium STOmics Merfish Custom VR Demo |
Single locations can be removed from the ROI selection. To remove a single location from the ROIs:
|
|
|
| Remove all selections
Visium Xenium STOmics Merfish Custom VR Demo |
All locations can be removed from all groups at once. To remove all selections:
|
|
|
| Export ROI selections
Visium Xenium STOmics Merfish Custom VR |
ROI selections can be exported. This will export all current selected locations and the respective groups they are in for later analysis. To export selections:
The export function will override the last selection. Save the selection locally by copying the export file.
|
|
|
| Import ROI selections
Visium VR |
To import previously saved ROI selections:
The export function does not check if the same dataset is used. Importing the last selection into a different dataset will cause errors. Ensure using the same data set to import as the one the export was generated from.
|
|
|
| 3D ROI selection
Visium Xenium STOmics Merfish Custom VR Demo |
In VR-Omics, it is possible to make 3D selections of ROIs if a 3D dataset (e.g. multiple Visium slides) is used. To make a 3D selection:
This allows the user to select 3D regions of interest. These selections can be exported as described above. To toggle between 3D and 2D selection, use the 3D selection button. |
|
|
Tissue Overlay Features
| Feature | Description | Icon | Image |
|---|---|---|---|
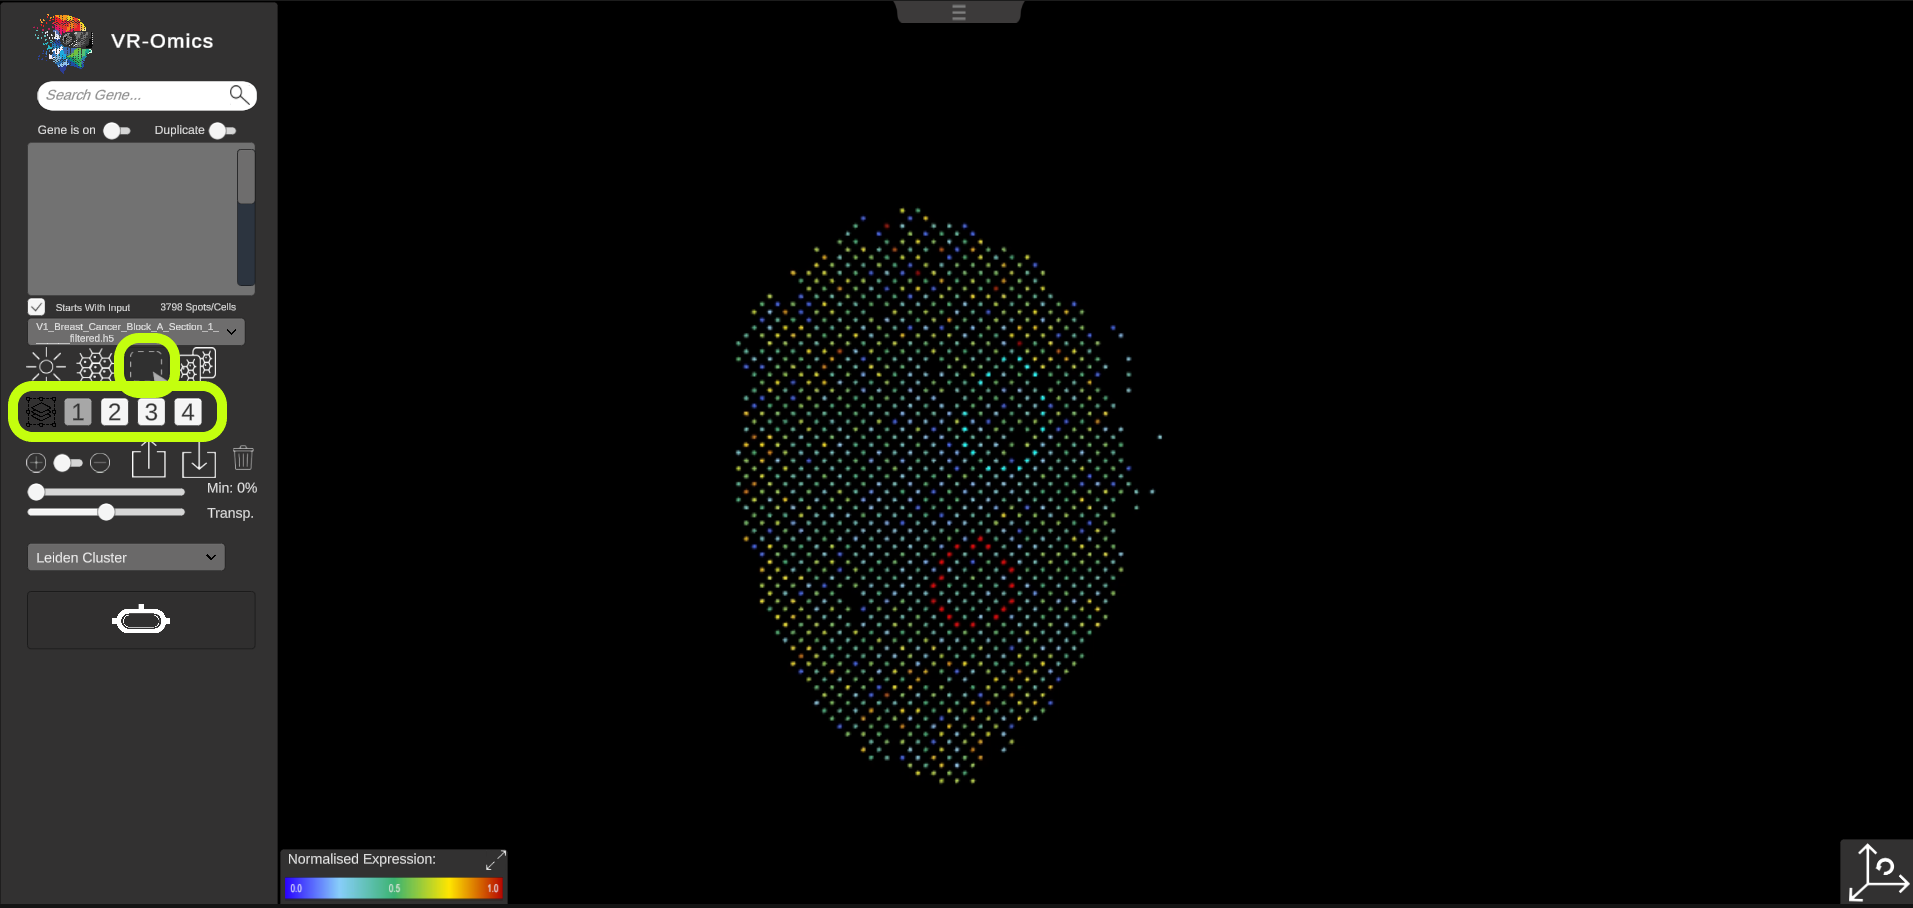
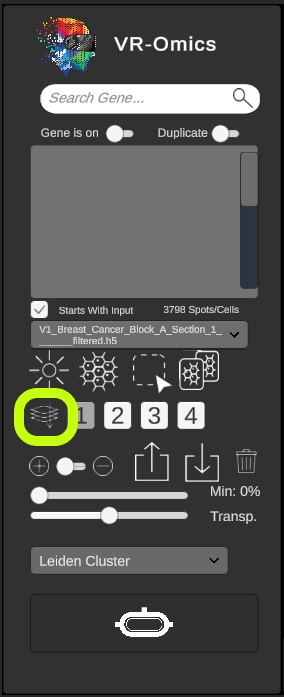
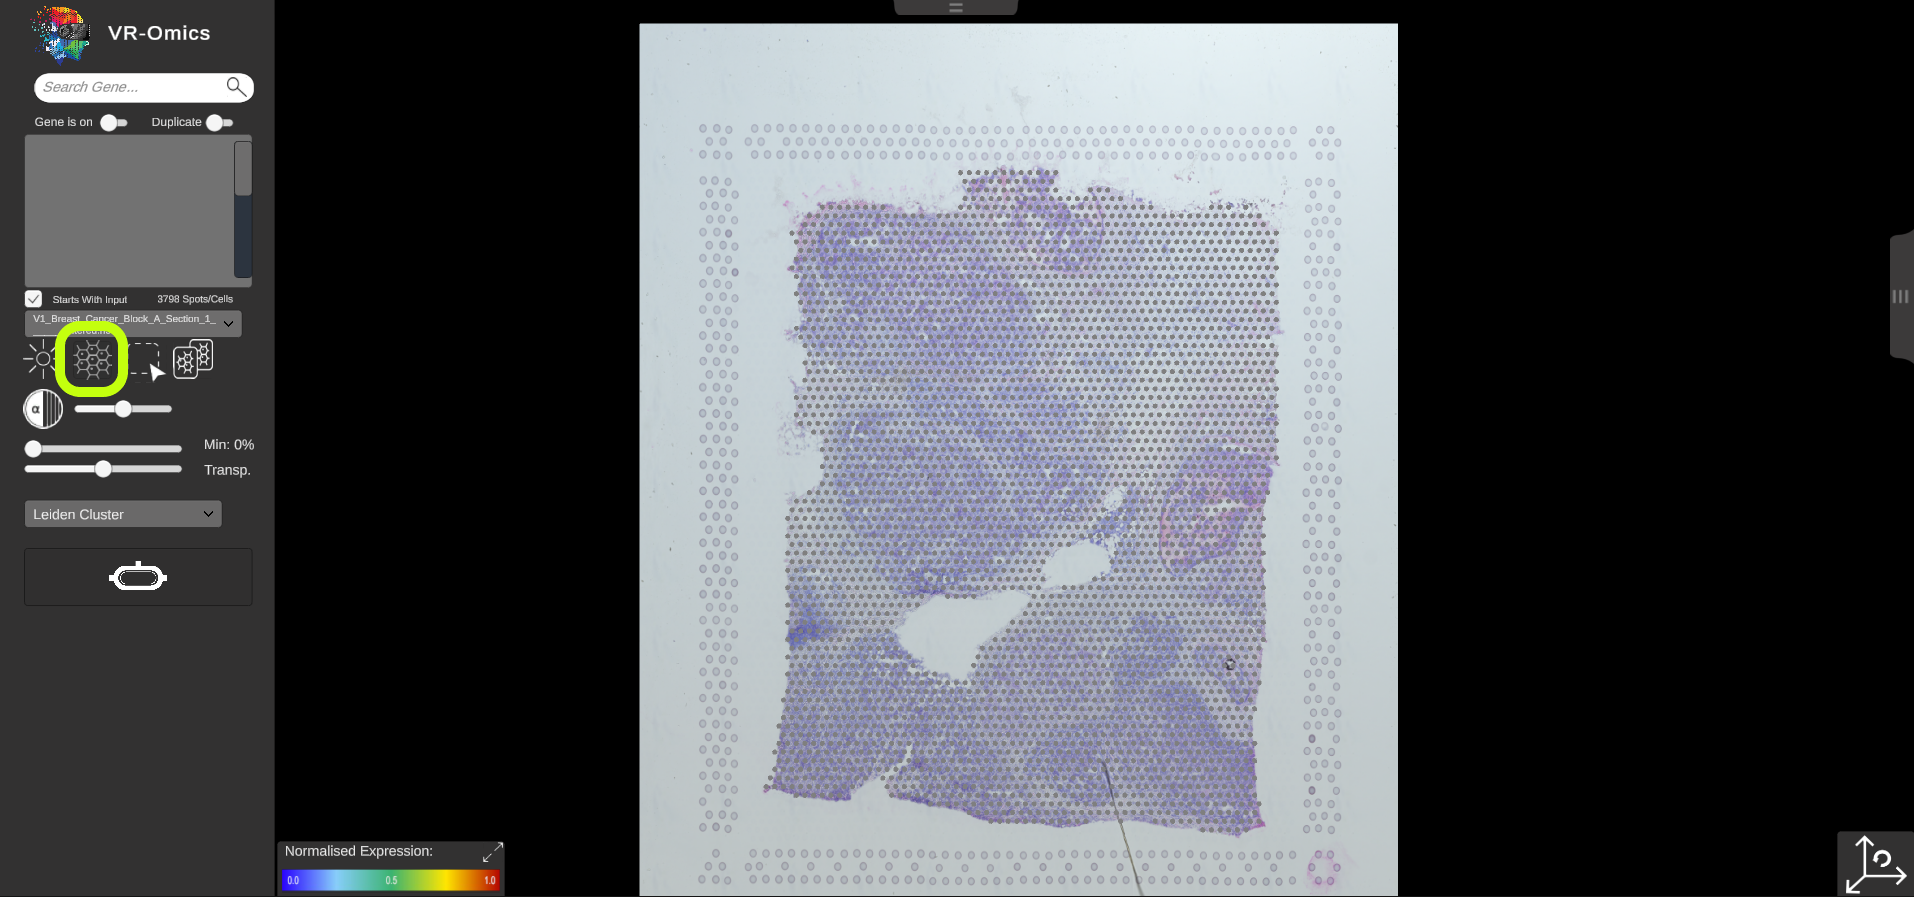
| Tissue Overlay
Visium VR |
The dataset can be overlaid with the respective tissue image. Use the tissue button to activate the tissue image overlay. The image is aligned automatically. The image will be automatically downloaded if the dataset was downloaded using VR-Omics Automated Workflow. If using a different dataset, ensure that the tissue file is called The tissue image provides additional spatial orientation. |
|
More information about the tissue alignment can be found in the 10X Genomics Spatial Outputs section. |
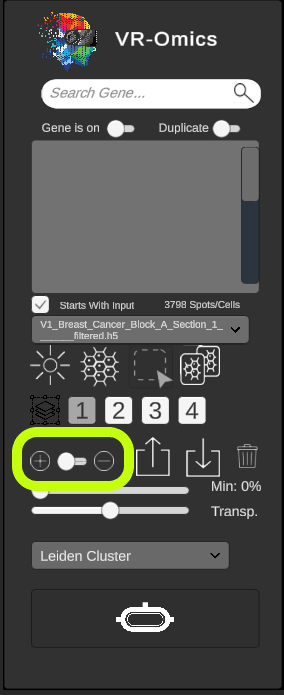
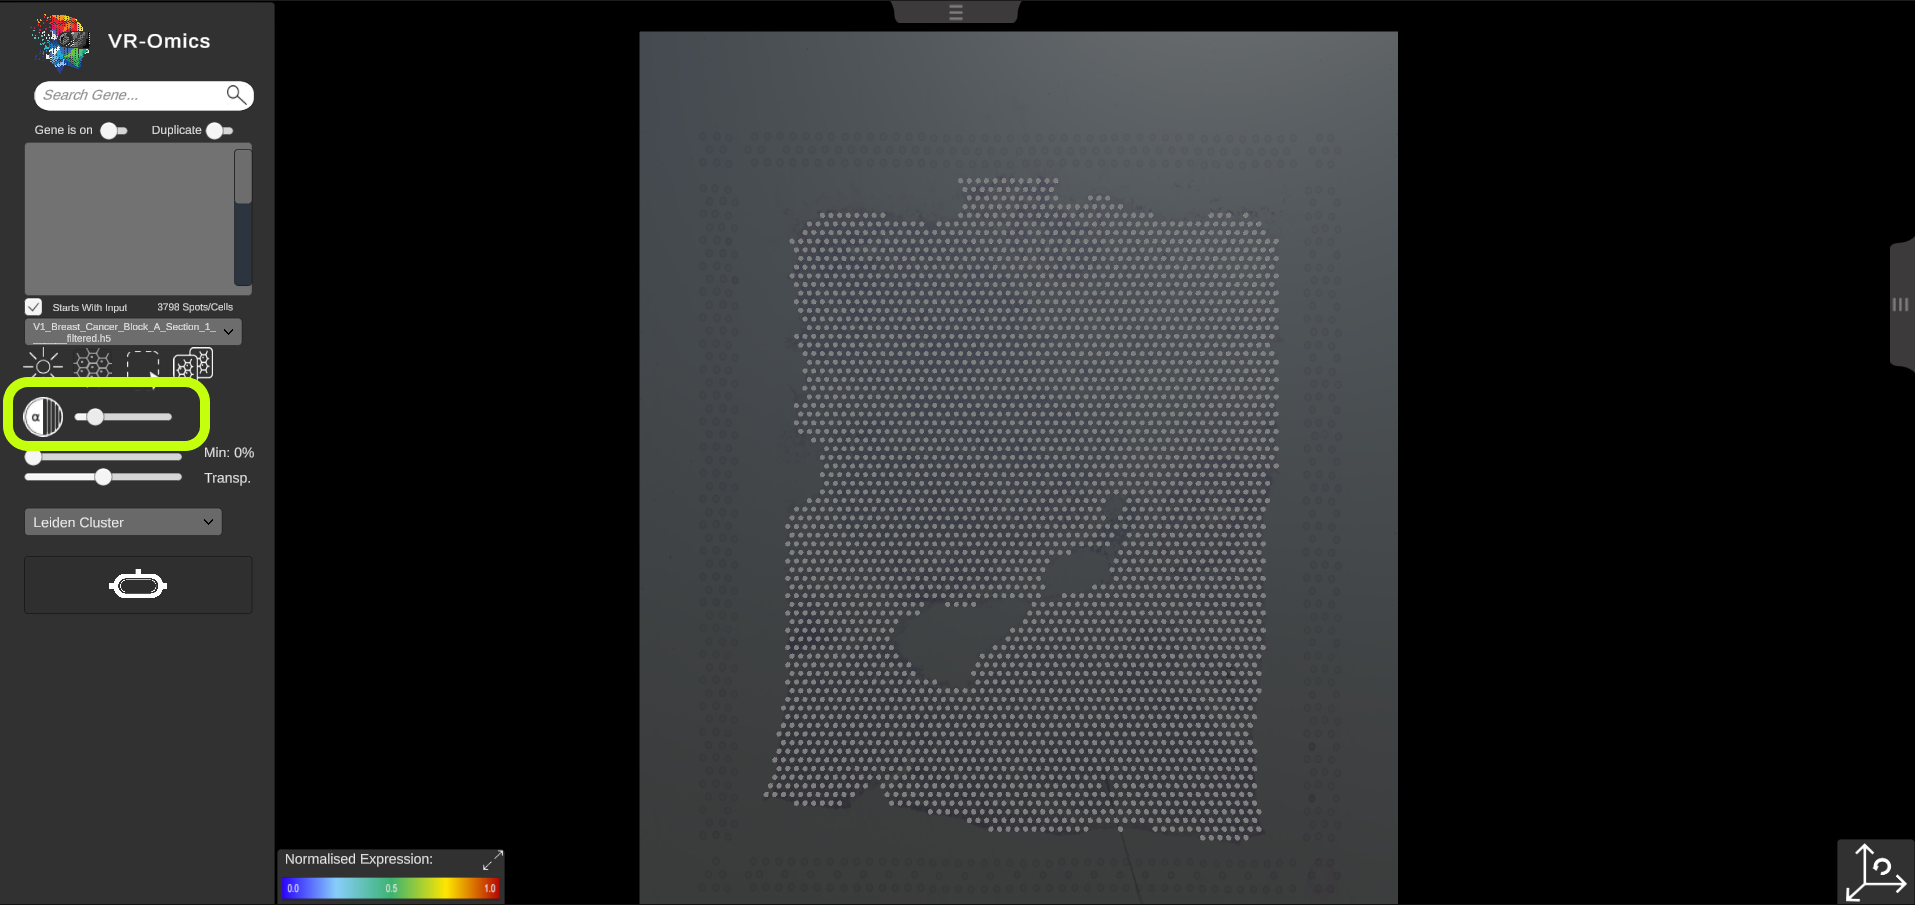
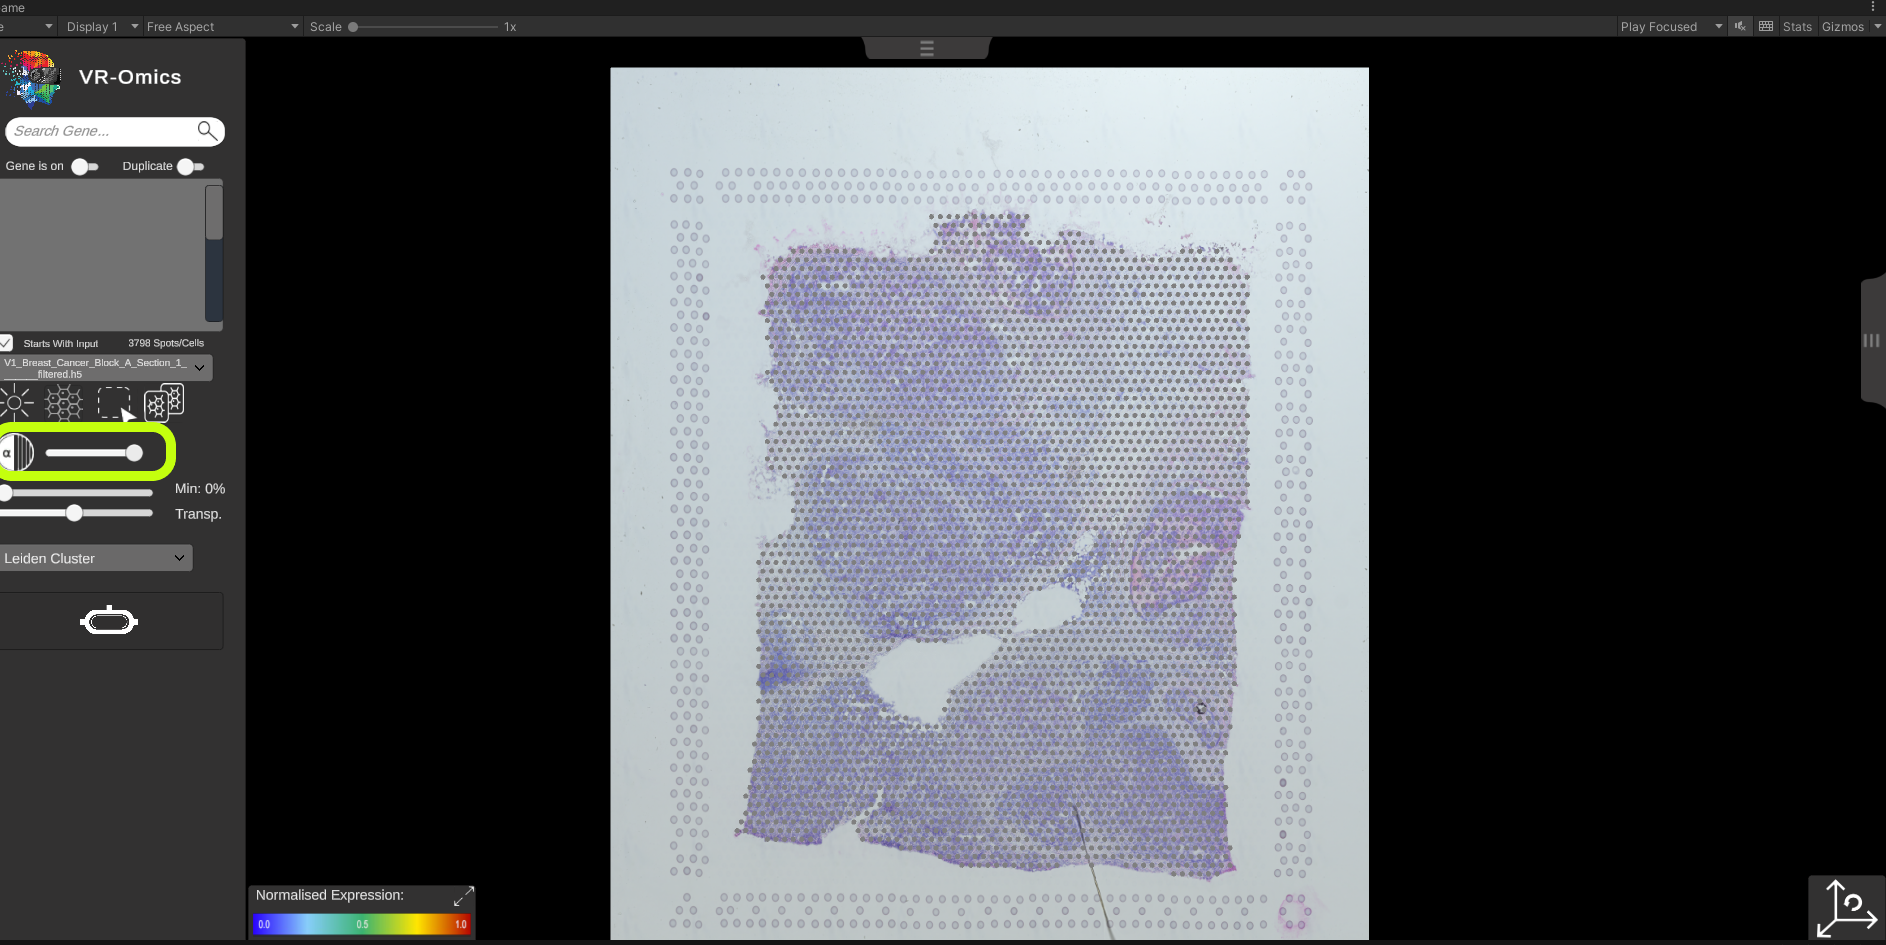
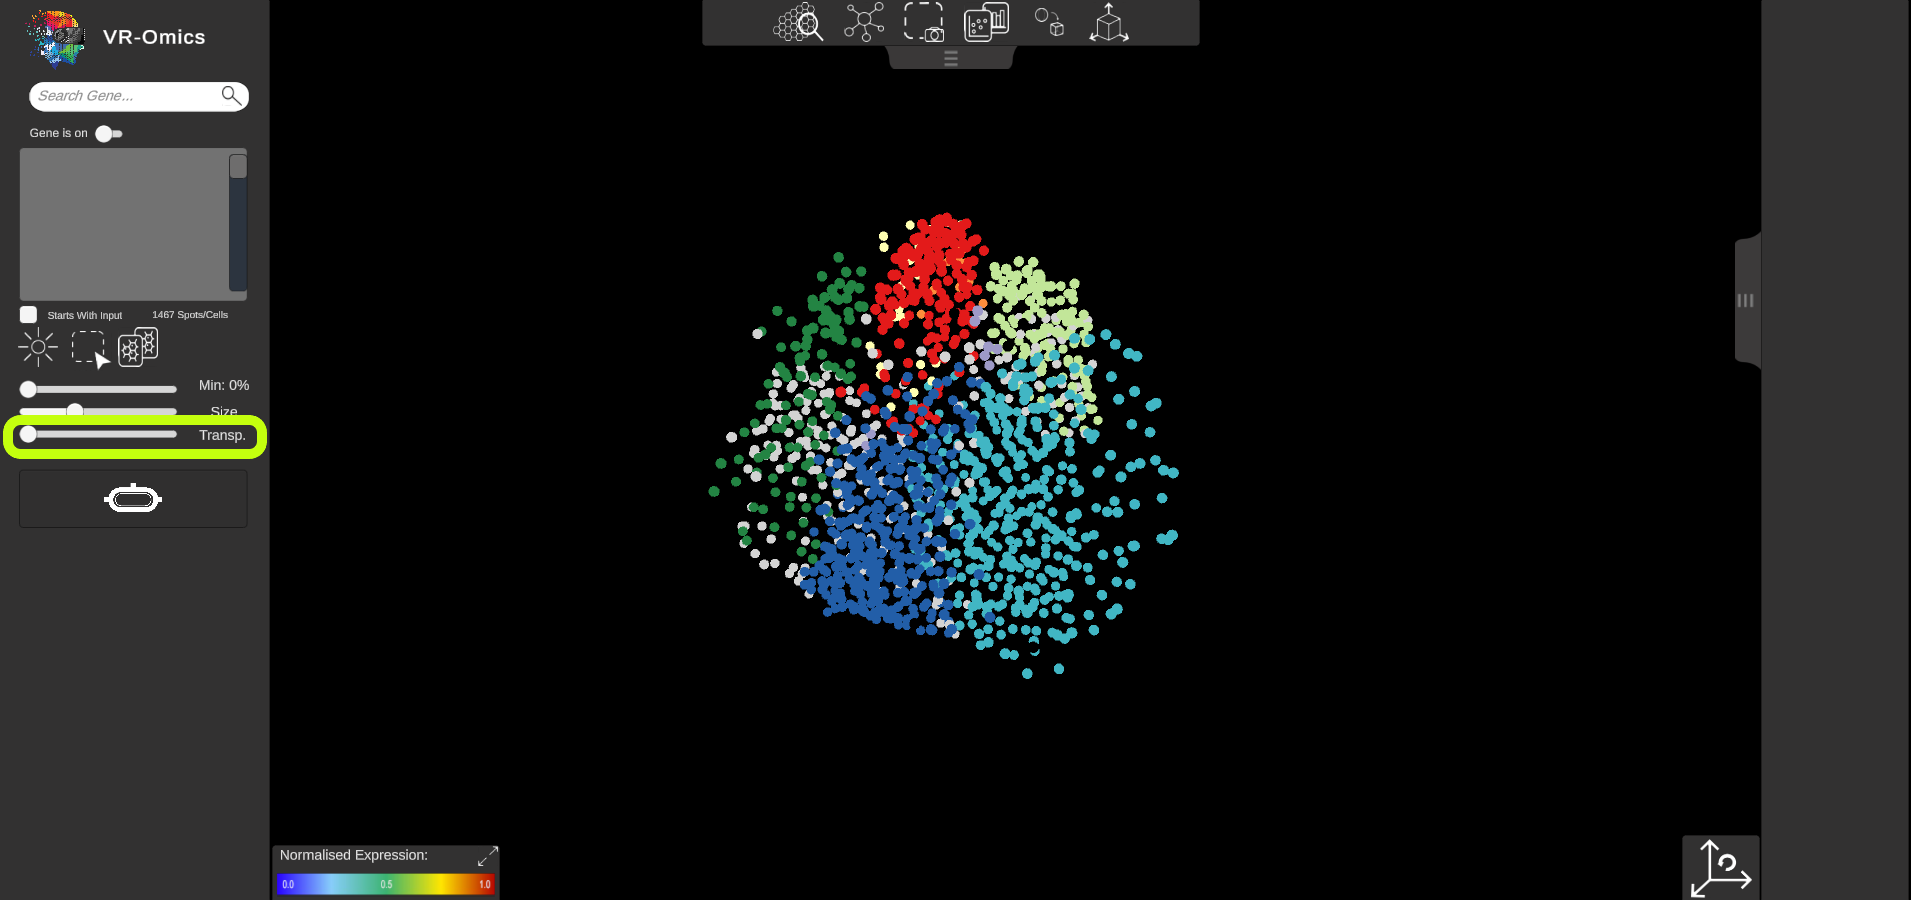
| Tissue Opacity
Visium VR |
The tissue opacity can be adjusted using the opacity slider in the tissue context menu. Move the slider to the left decreased the tissue opacity. Move the slider to the right increases the tissue opacity. |
|
|
Explorative Comparison Features
| Feature | Description | Icon | Image |
|---|---|---|---|
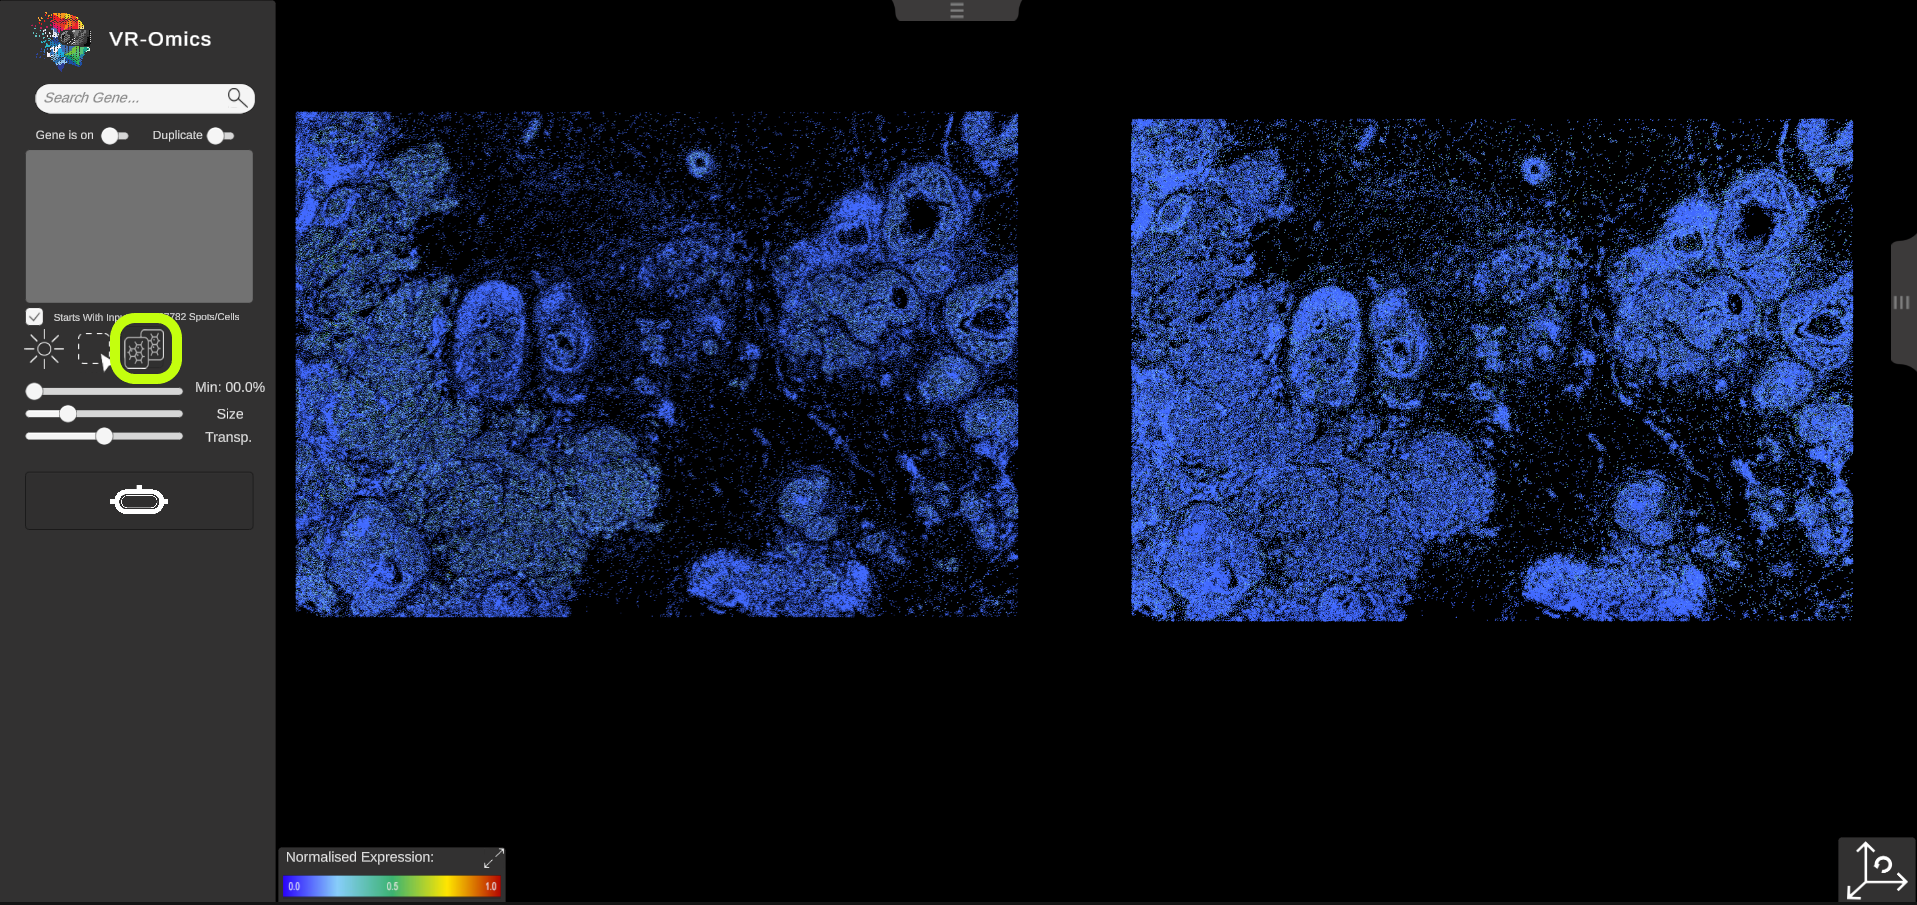
| Side-by-Side comparison
Visium Xenium STOmics Merfish Custom VR Demo |
The side-by-side comparison feature allows comparing two different gene expression patterns next to each other. To enable the feature, click on the "Compare" button in the menu. The current dataset will be duplicated. Additionally, a slider with the label If the slider is set to left, and a new gene is selected from the search bar, the gene will be applied to the left dataset. If the slider is set to right, the next gene will be applied to the right side of the dataset. This feature can be combined with the ROI selection tool, where ROIs will be visualized in both datasets. |
|
|
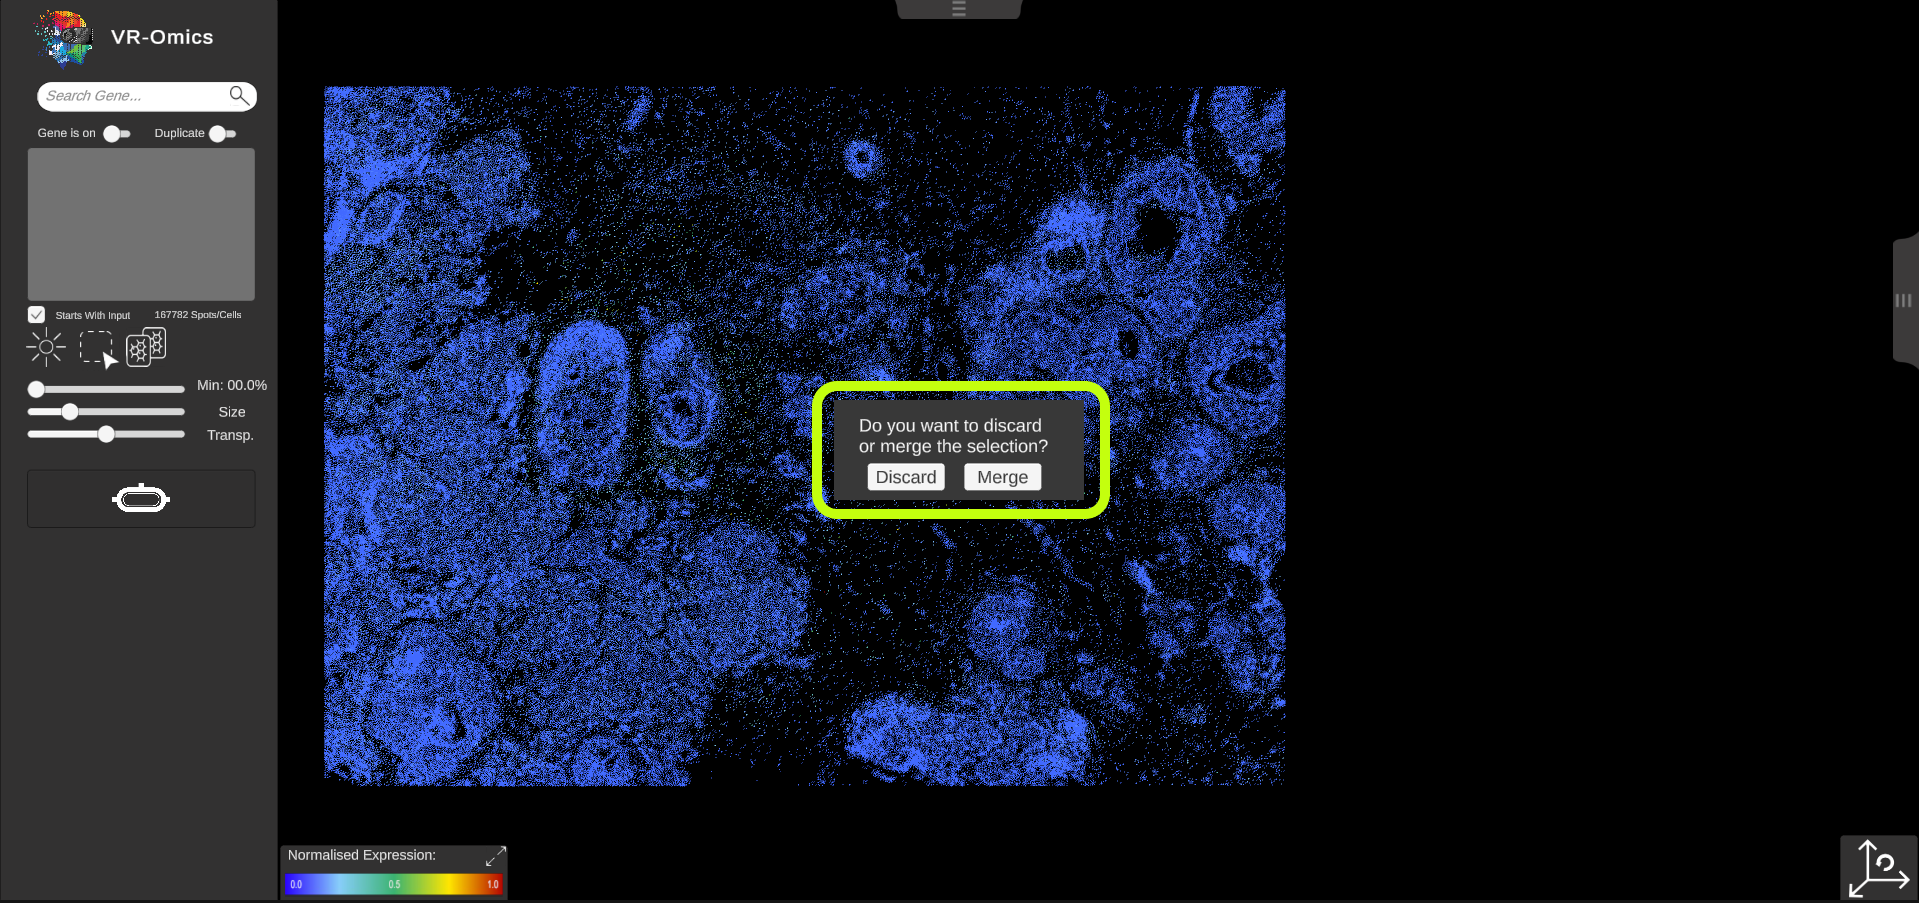
| Comparison of two gene expression patterns
Visium Xenium STOmics Merfish Custom VR Demo |
If the side-by-side comparison feature is disabled while two different genes were selected, a dialog menu will open asking to merge or discard the selection. If the user decides to merge the selection, a vector based difference analysis is performed. The difference between the both genes selected in each location will be calculated and visualised in a heatmap like manner. This allows easily to visualise regions of similarity or high differences. |
|
|
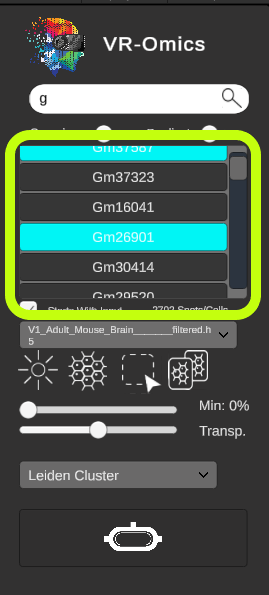
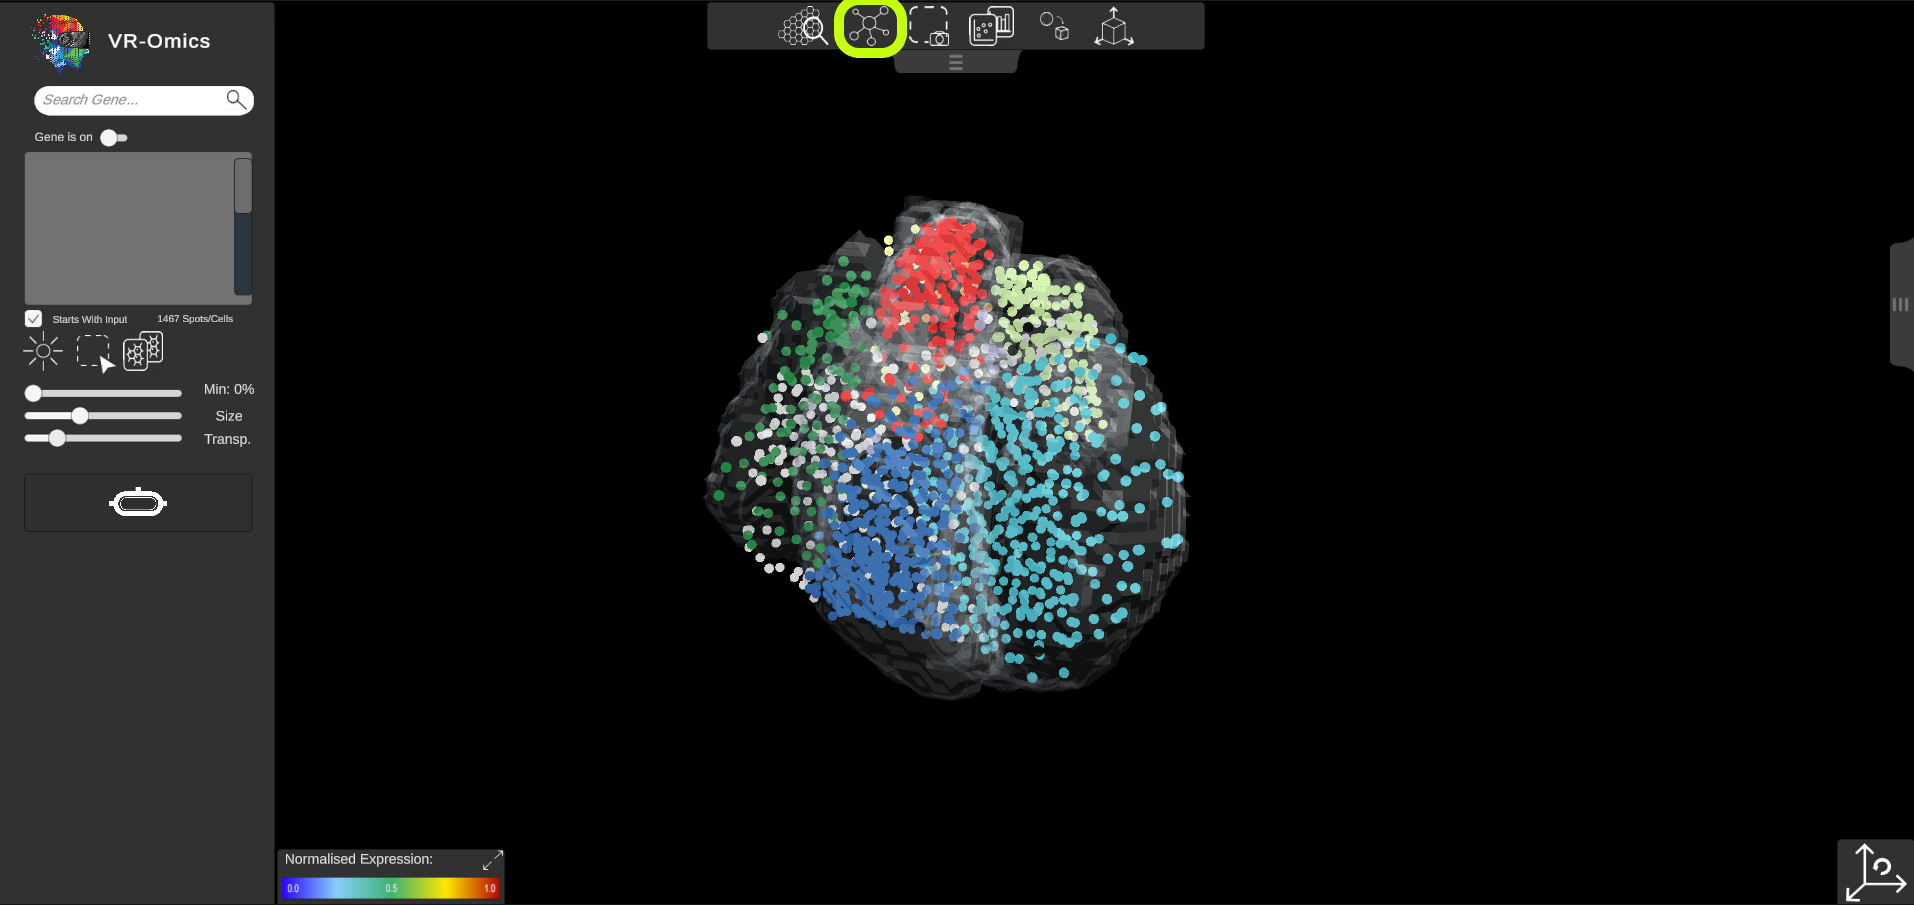
| Showing spatially variable genes (SVGs) results
Visium Xenium STOmics Merfish Tomo-Seq Custom VR Demo |
If the SVG analysis was performed using the VR-Omics Autoamted Workflow, the Visualiser is able to highlight the SVGs in the search results. If a term is entered into the search bar, the autocomplete feature will show the search results for the available genes. The buttons for SVGs will be highlighted in cyan. |
|
|
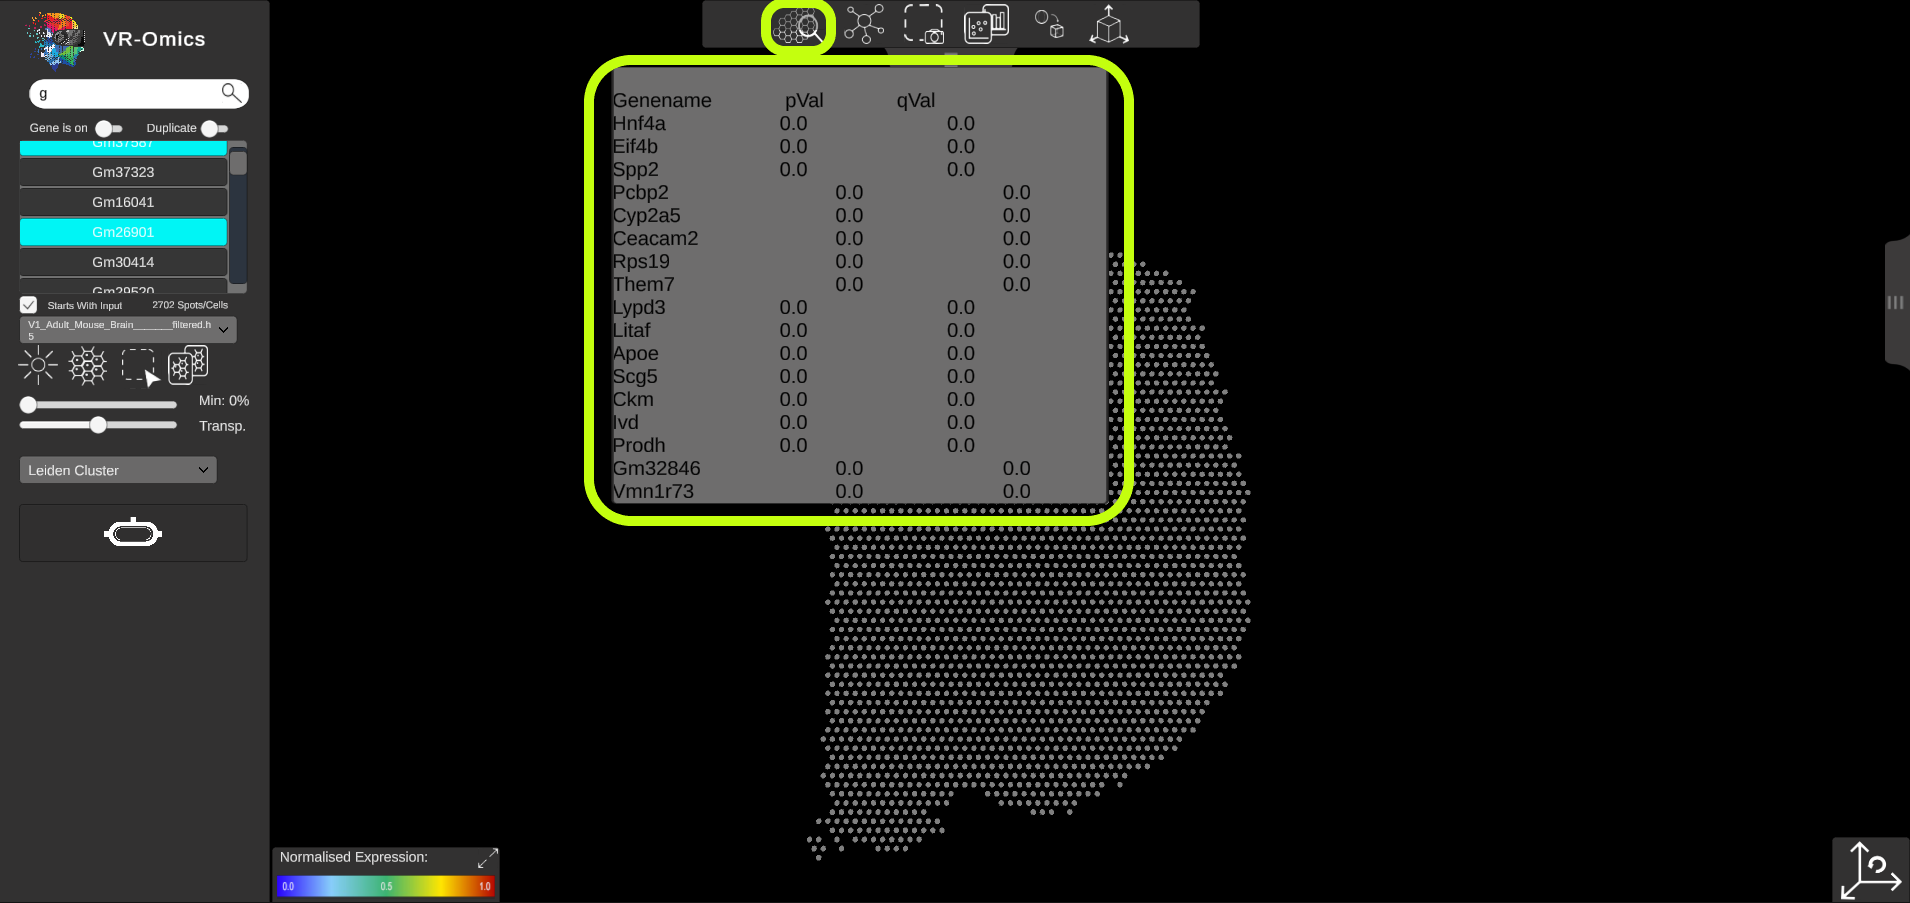
| Browse SVG results in the Visualiser
Visium Xenium STOmics Merfish Tomo-Seq Custom VR Demo |
If the SVG analysis was performed using the VR-Omics Autoamted Workflow, the SVG results can be browsed from the Visualiser:
|
|
|
Export Features
| Feature | Description | Icon | Image |
|---|---|---|---|
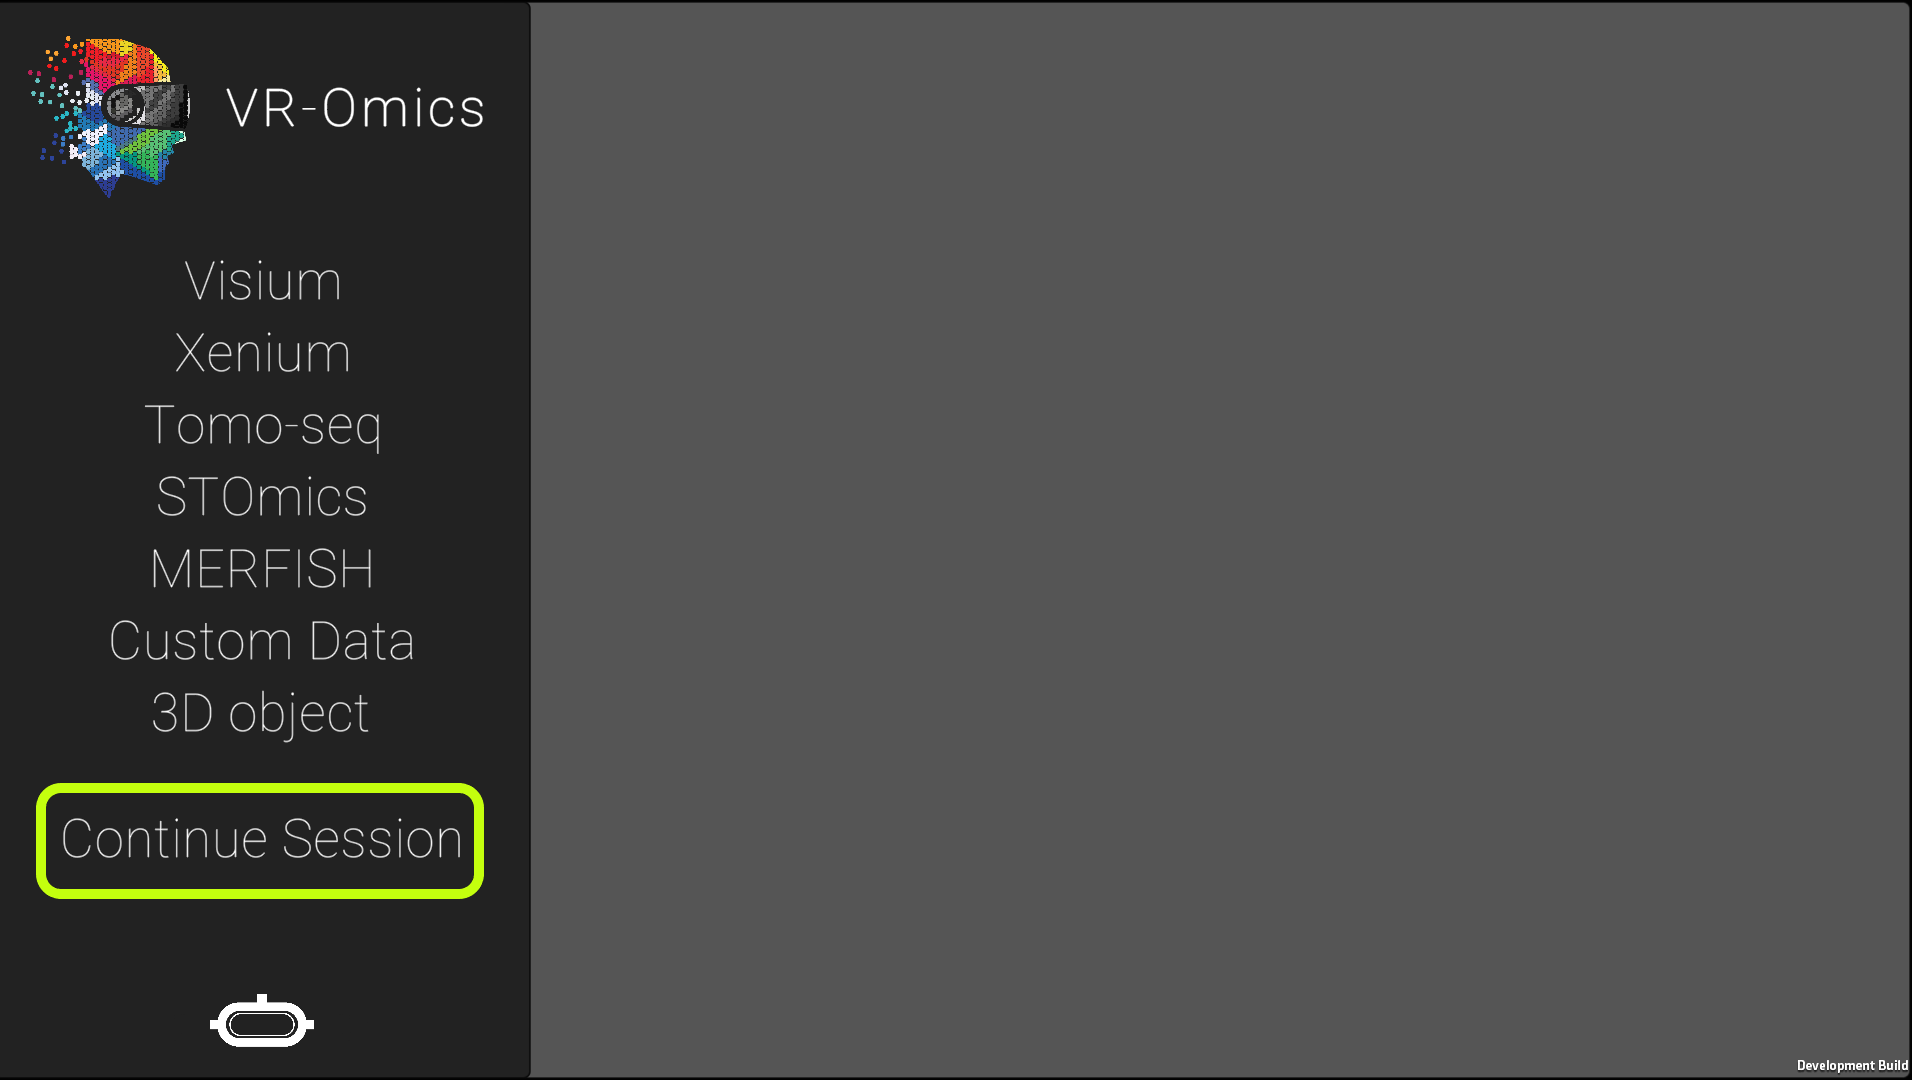
| Continue Session
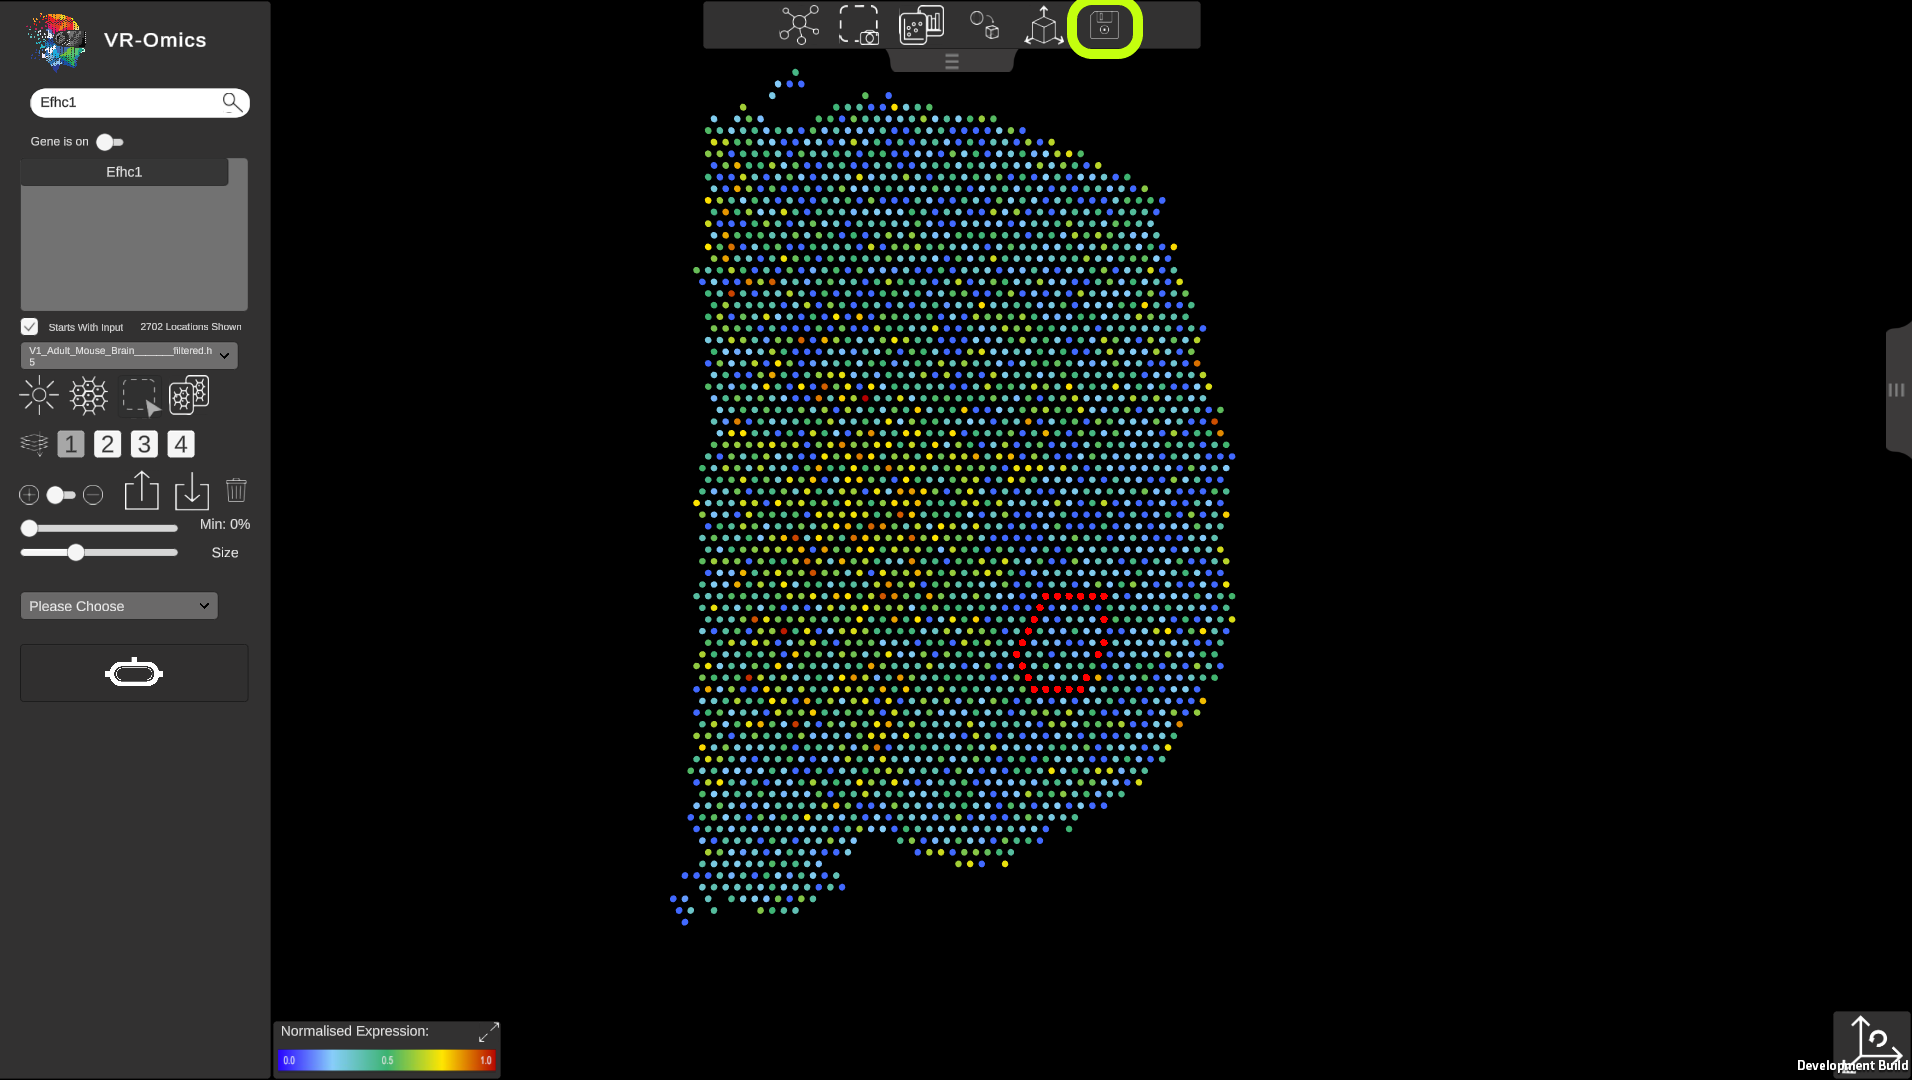
Visium Xenium STOmics Merfish Tomo-Seq Custom VR Demo |
Your current session can be saved and continued to a later time point. This will include:
To save the session select the top menu and click on the To continue a saved session, from the main menu select the Keep in mind that saving the current session will override the last session saved. The sessions are saved as json files within the data structure. |
|
|
| Screenshot
Visium Xenium STOmics Merfish Tomo-Seq Custom VR Demo |
Screenshots can be made from the visualiser. For the screenshot only the dataset will be shown. To make a screenshot:
|
|
|
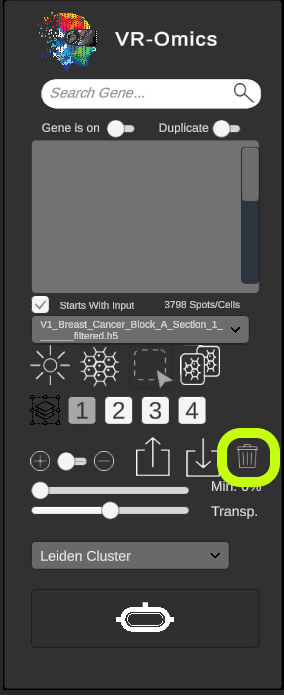
| Export ROI selections
Visium VR |
ROI selections can be exported. This will export all current selected locations and the respective groups they are in for later analysis. To export selections:
The export function will override the last selection. Save the selection locally by copying the export file.
|
|
|
| Import ROI selections
Visium VR |
To import previously saved ROI selections:
The export function does not check if the same dataset is used. Importing the last selection into a different dataset will cause errors. Ensure using the same data set to import as the one the export was generated from.
|
|
|
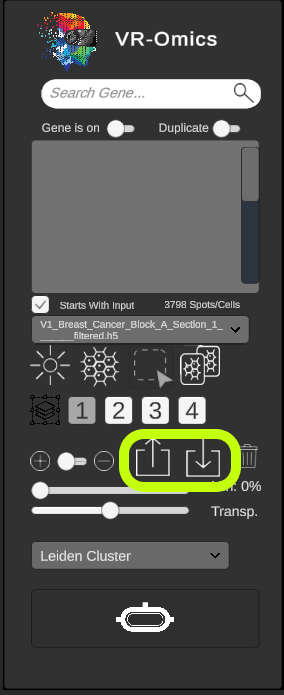
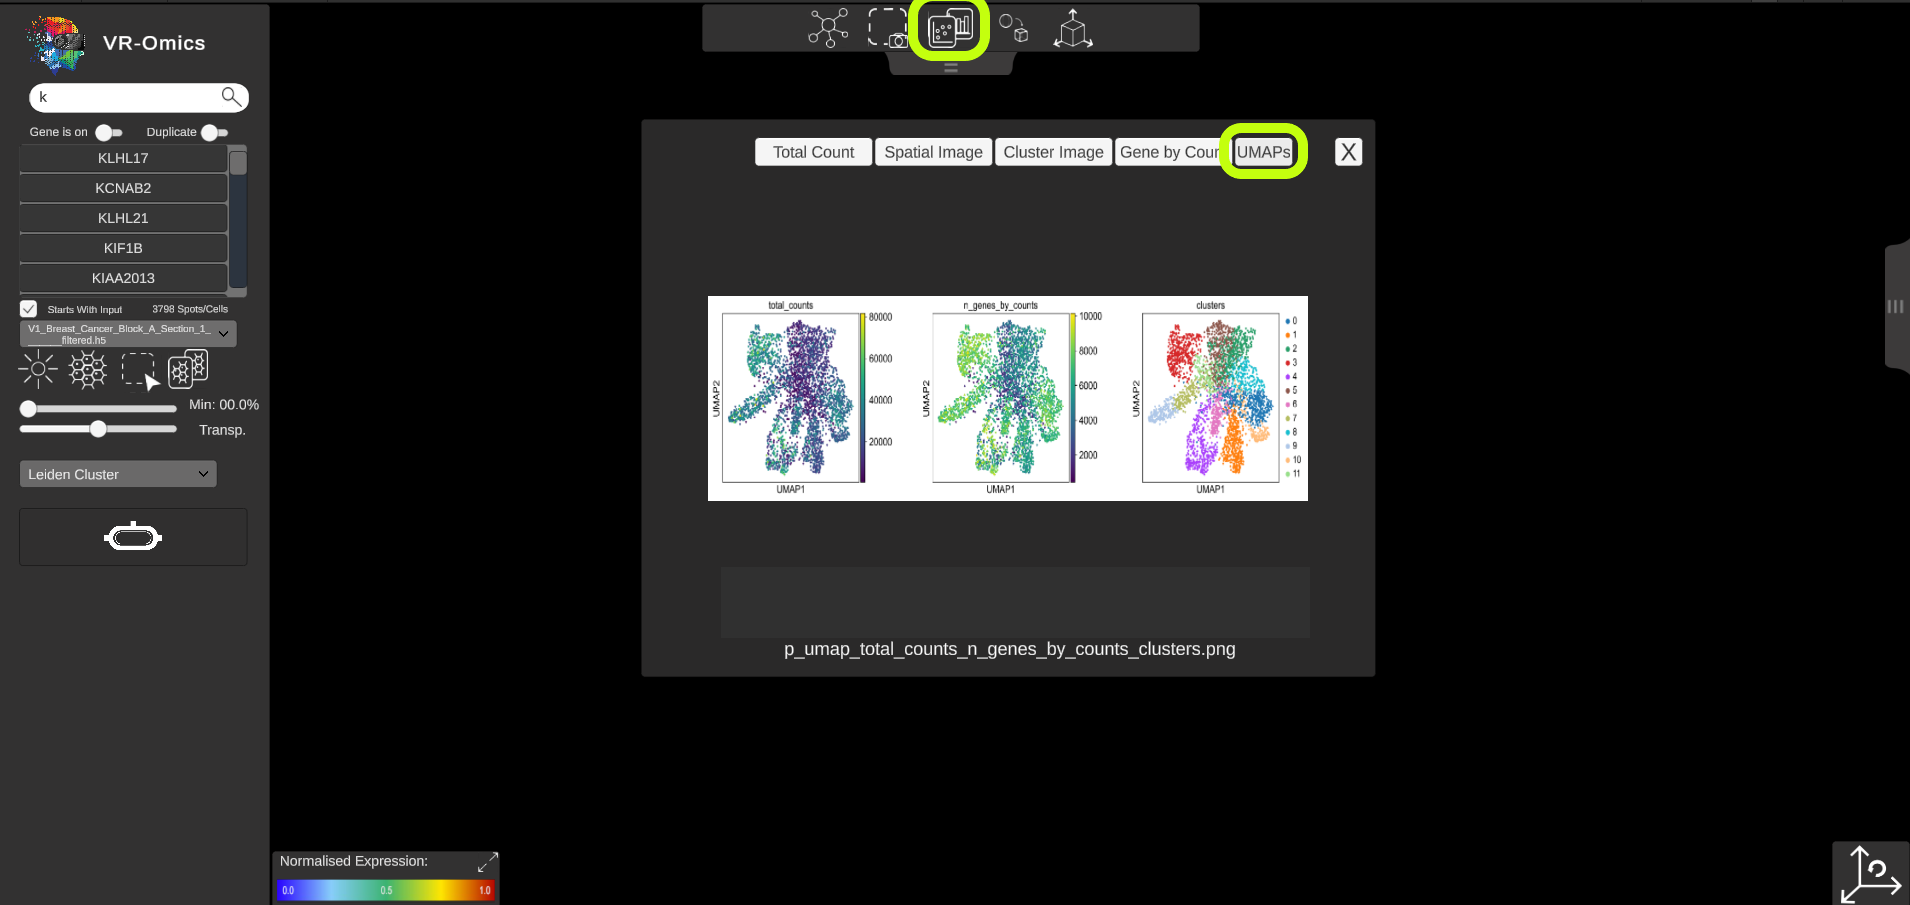
| Output plots
Visium VR |
If the VR-Omics Automated Workflow was used to download the Visium data optionally the output plots can be generated. The plots will be saved within the sample folder in the VR-Omics folder The plots can also be quick accessed from the top menu through the Visualiser |
|
|
Switch VR and Desktop Application
| Feature | Description | Icon | Image |
|---|---|---|---|
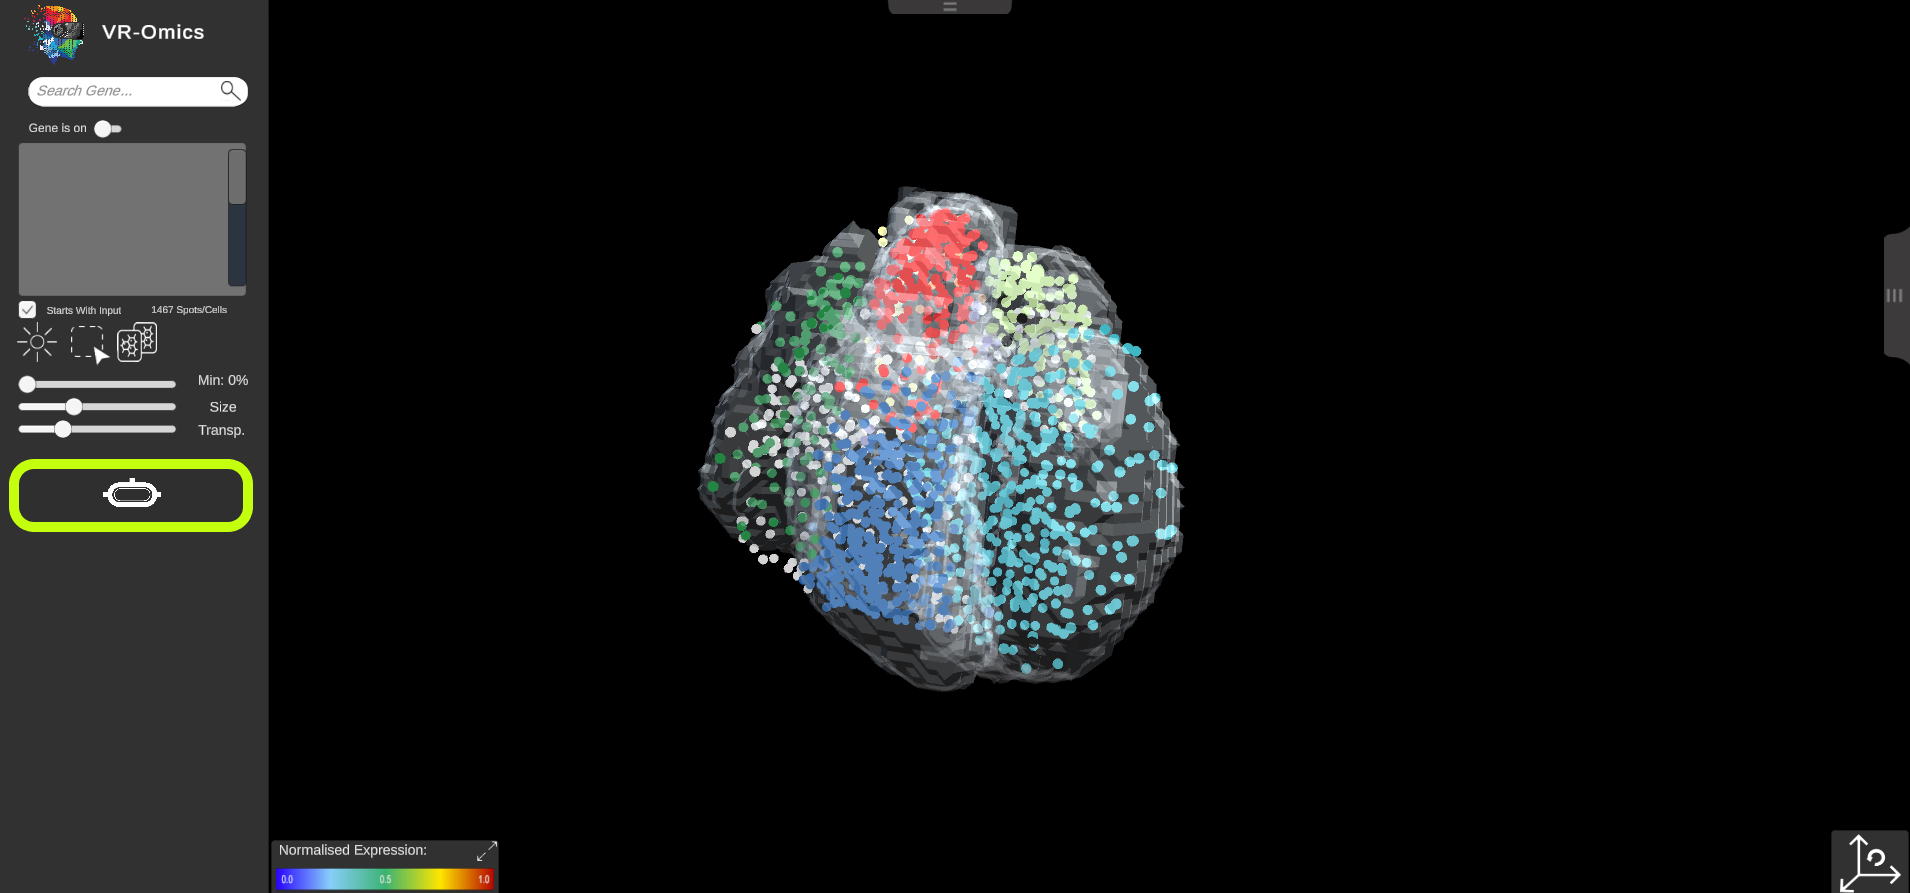
| Switching between desktop and VR application
Visium Xenium STOmics Merfish Tomo-Seq Custom VR Demo |
VR-Omics allows to easily switch between the desktop application and the VR environment:
We used the VR toolkit plugin (XR Interaction Toolkit version 2.0.3) supported are all devices that are supported by the toolkit. The following headsets have been confirmed to work with the plugin but not all are tested with VR-Omics: Windows Mixed Reality (eg: HP Reverb, Samsung Odyssey), Oculus Quest & Quest 2, Pimax 5K & 8KX, Varjo Aero & VR-3, Valve Index, HTC Vive, HTC Vive Cosmos, Pico Neo 3 & 4. We recommend using the Oculus Quest 2 or Quest Pro |
off on |
|
Additional Parameters to Explore
| Feature | Description | Icon | Image |
|---|---|---|---|
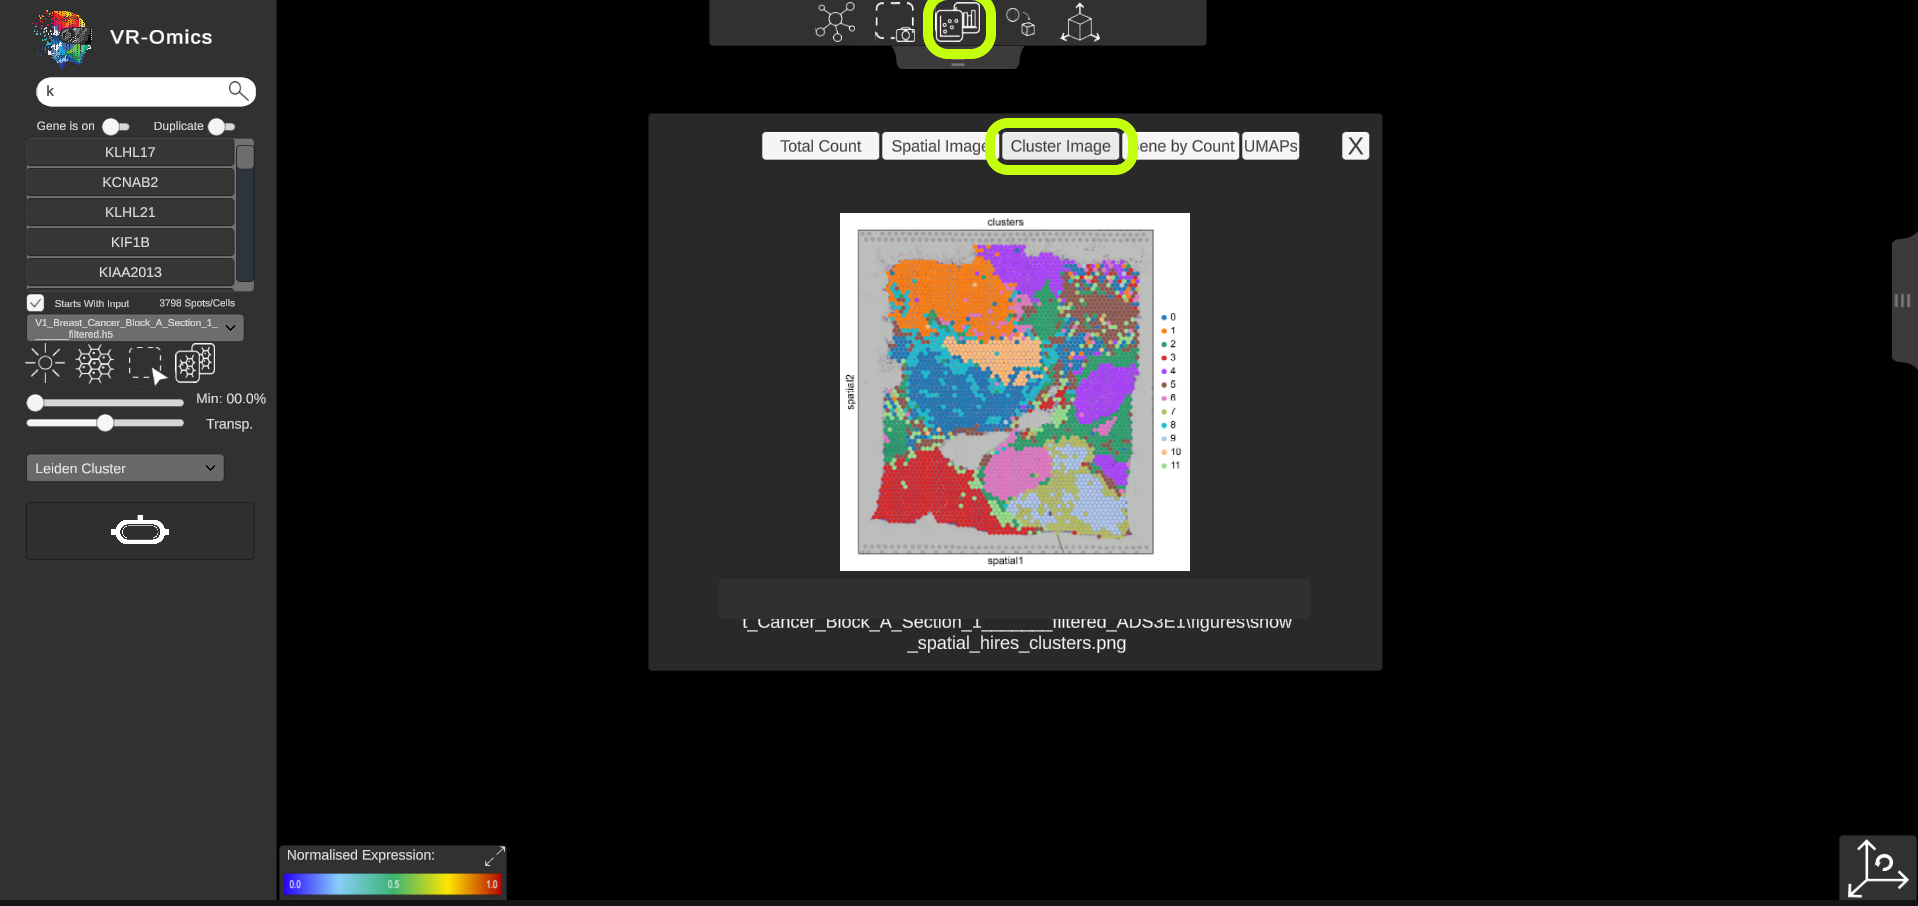
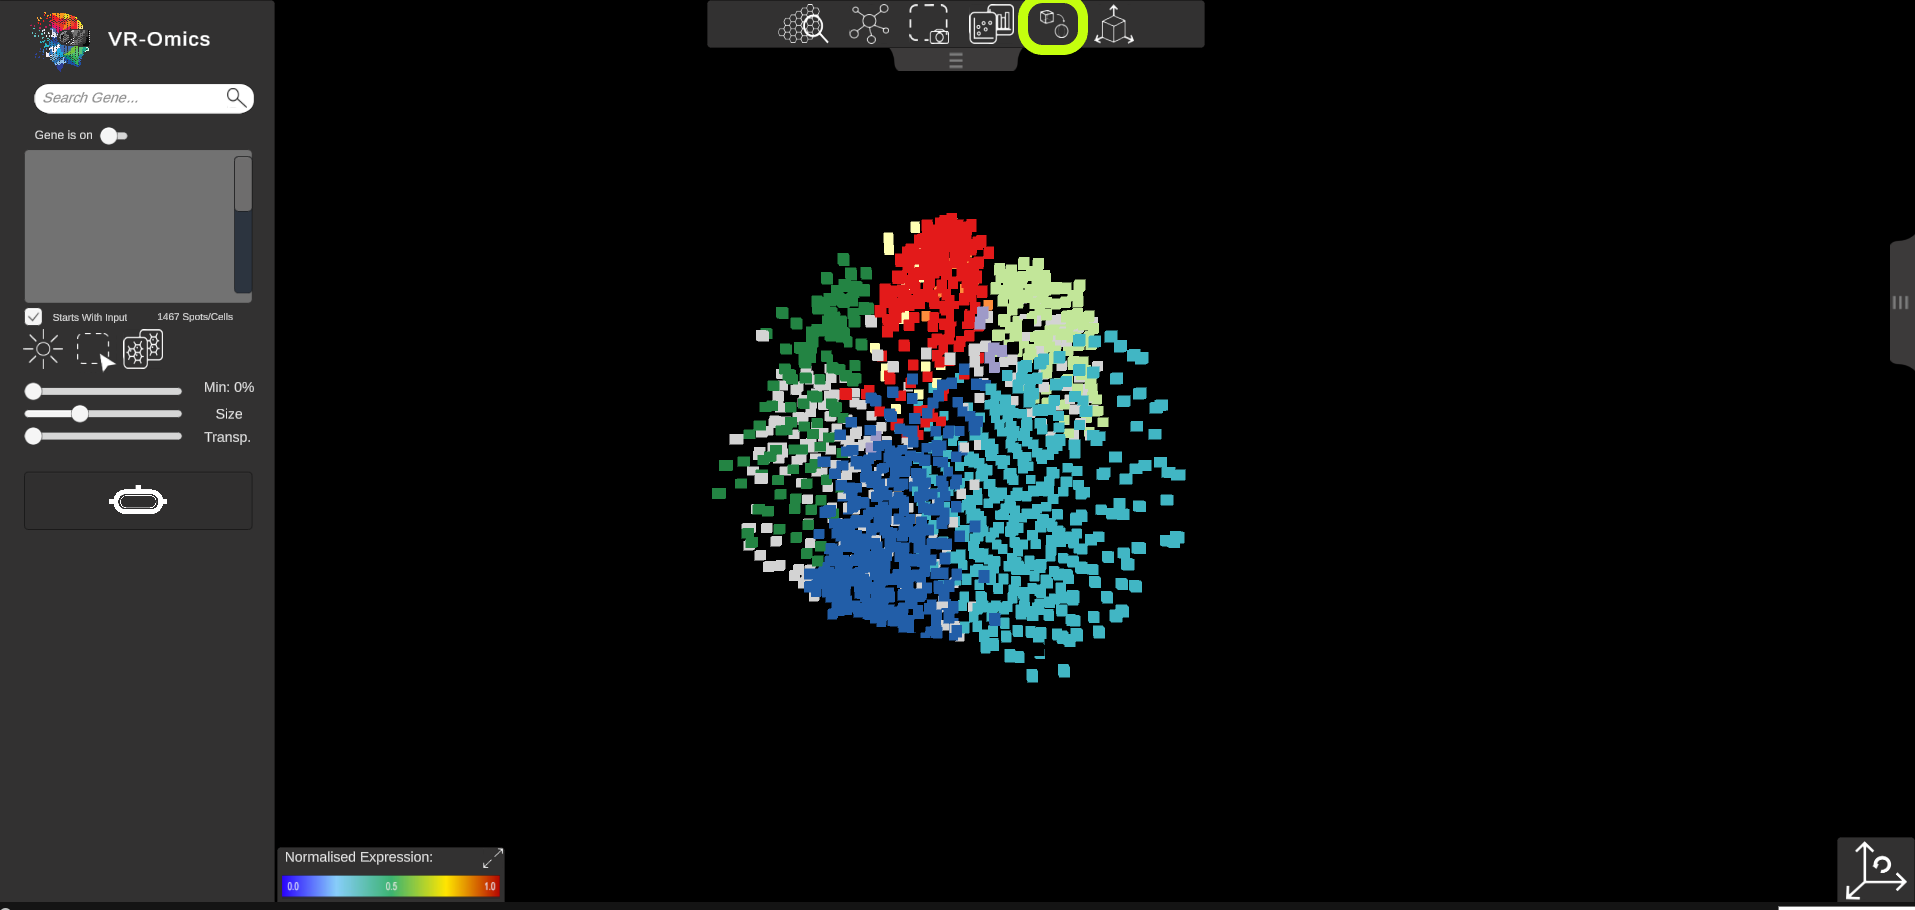
| Show Cluster information
Visium Xenium STOmics Merfish Tomo-Seq Custom VR Demo |
If cluster information is available it can be visualised in the VR-Omics Visualiser:
|
|
|
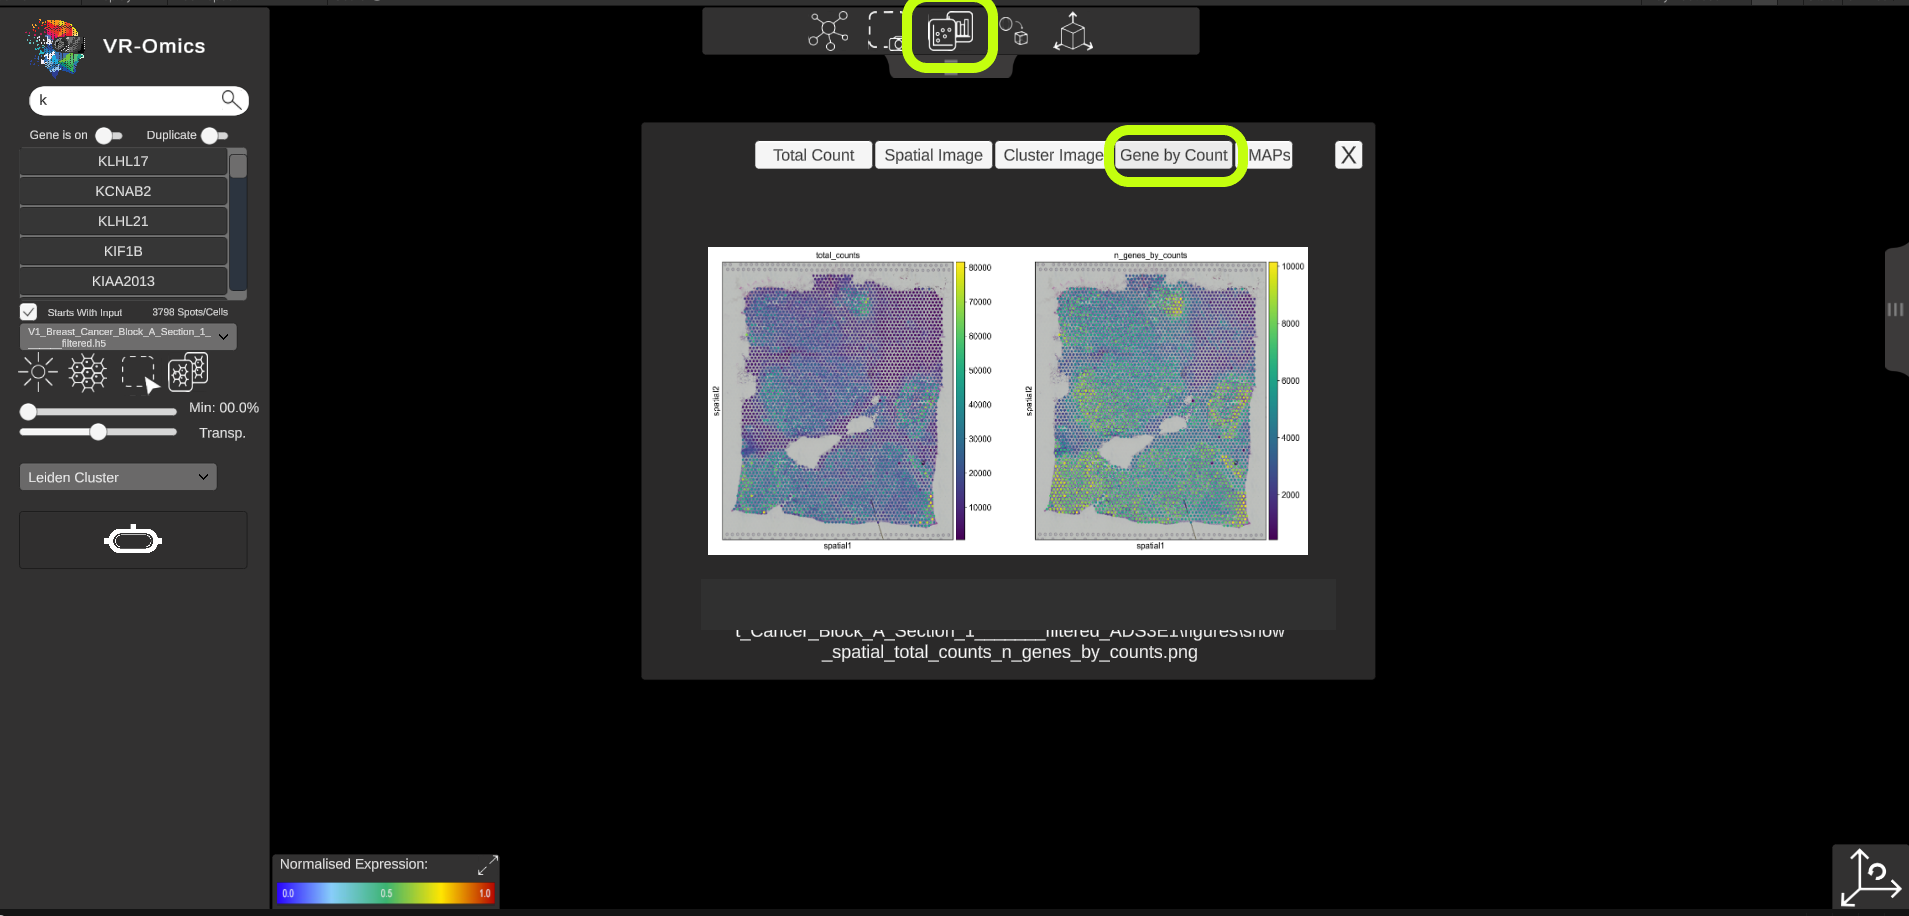
| Access spatial plots
Visium VR |
If spatial plots are available they can be visualised in the VR-Omics Visualiser: More information on which plots are available with the VR-Omics Automated Workflow can be found here To show the plots in the Visualiser:
|
|
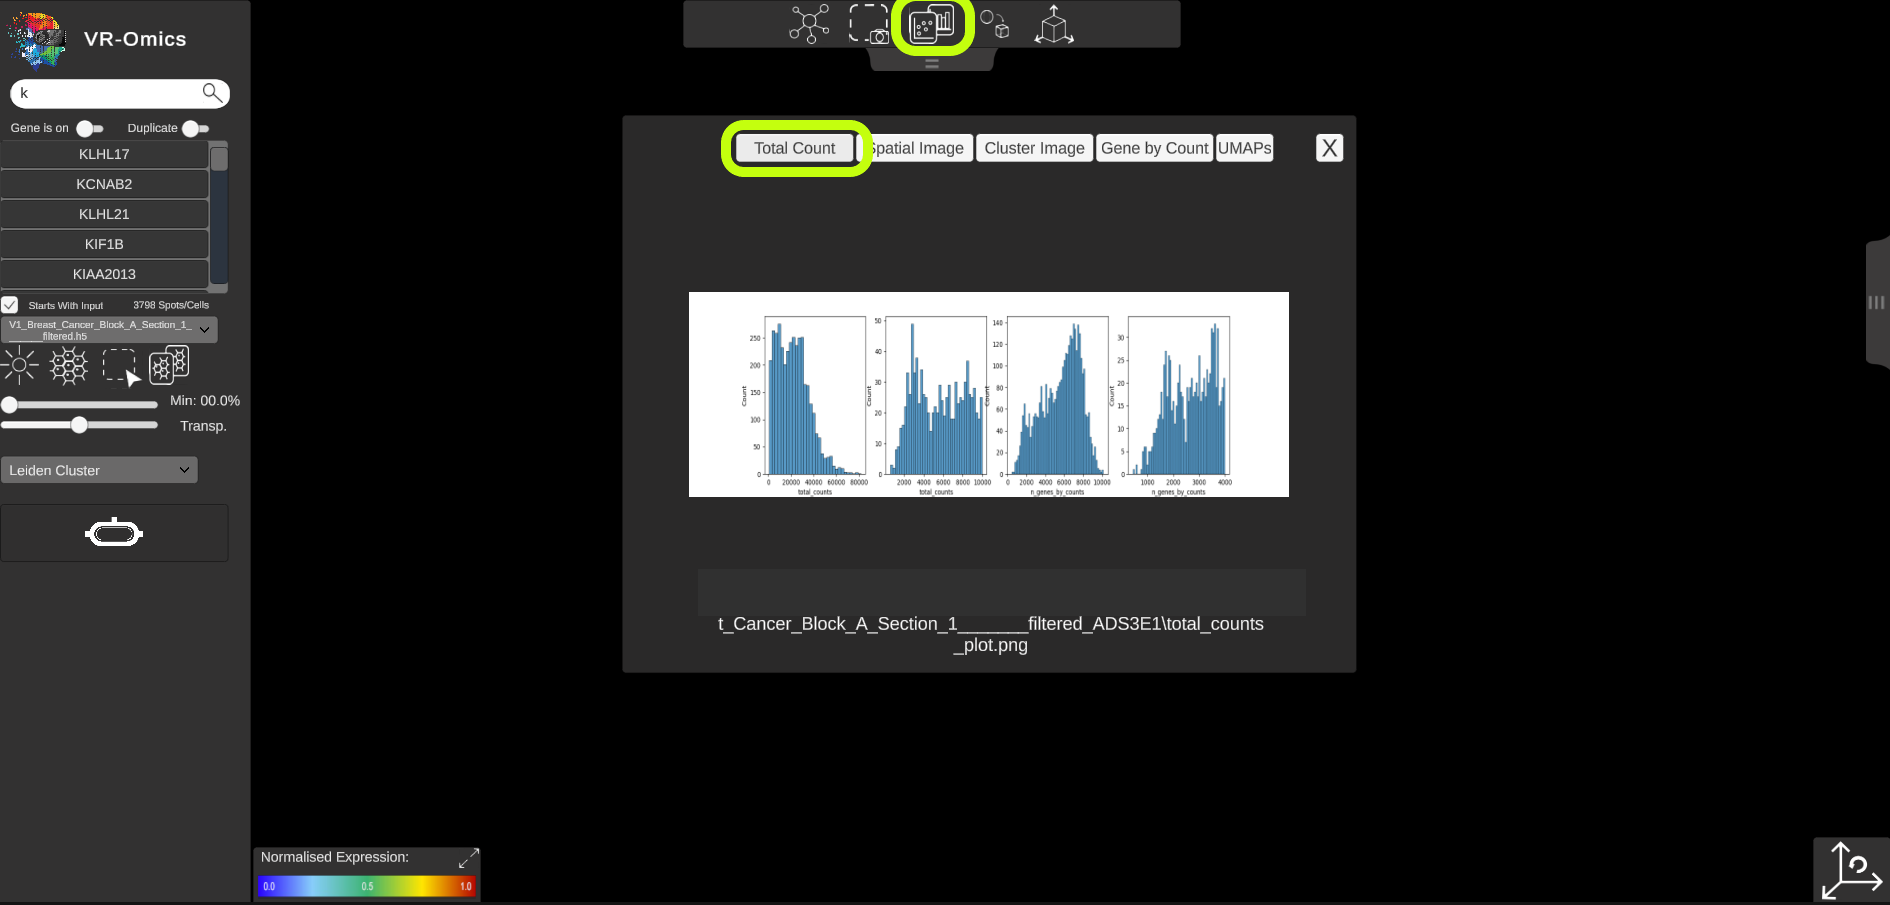
Show all available plots: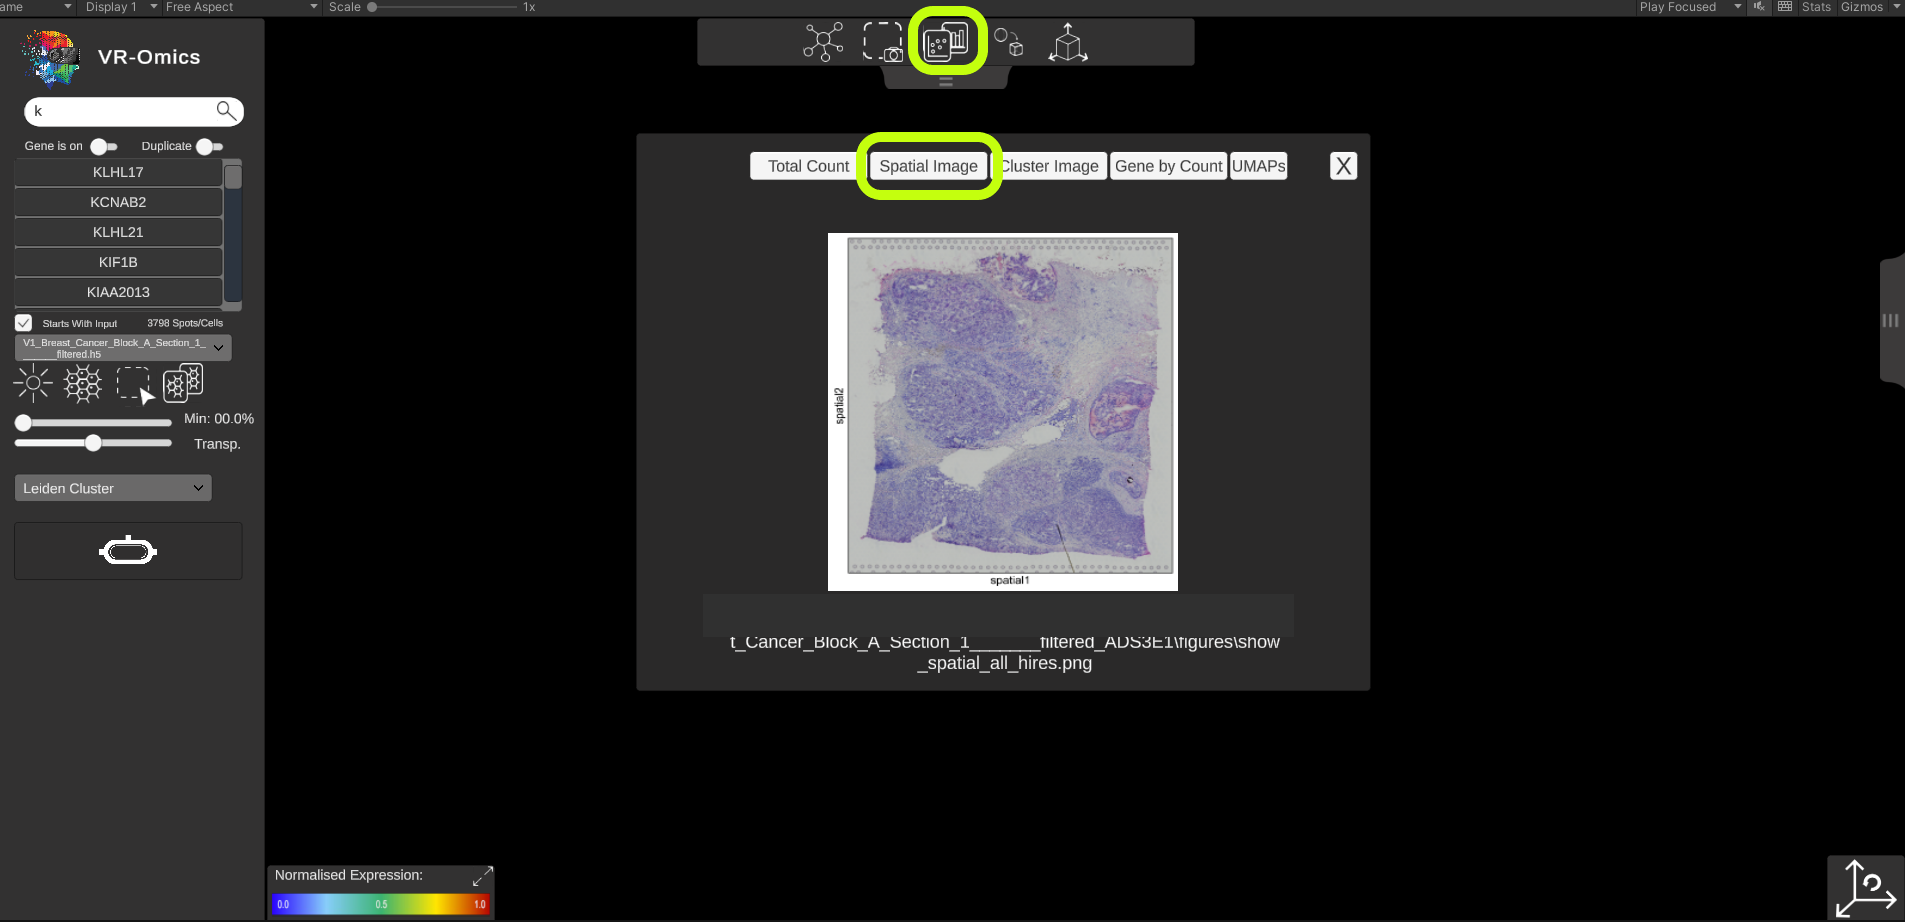
|
3D Object Alignment
| Feature | Description | Icon | Image |
|---|---|---|---|
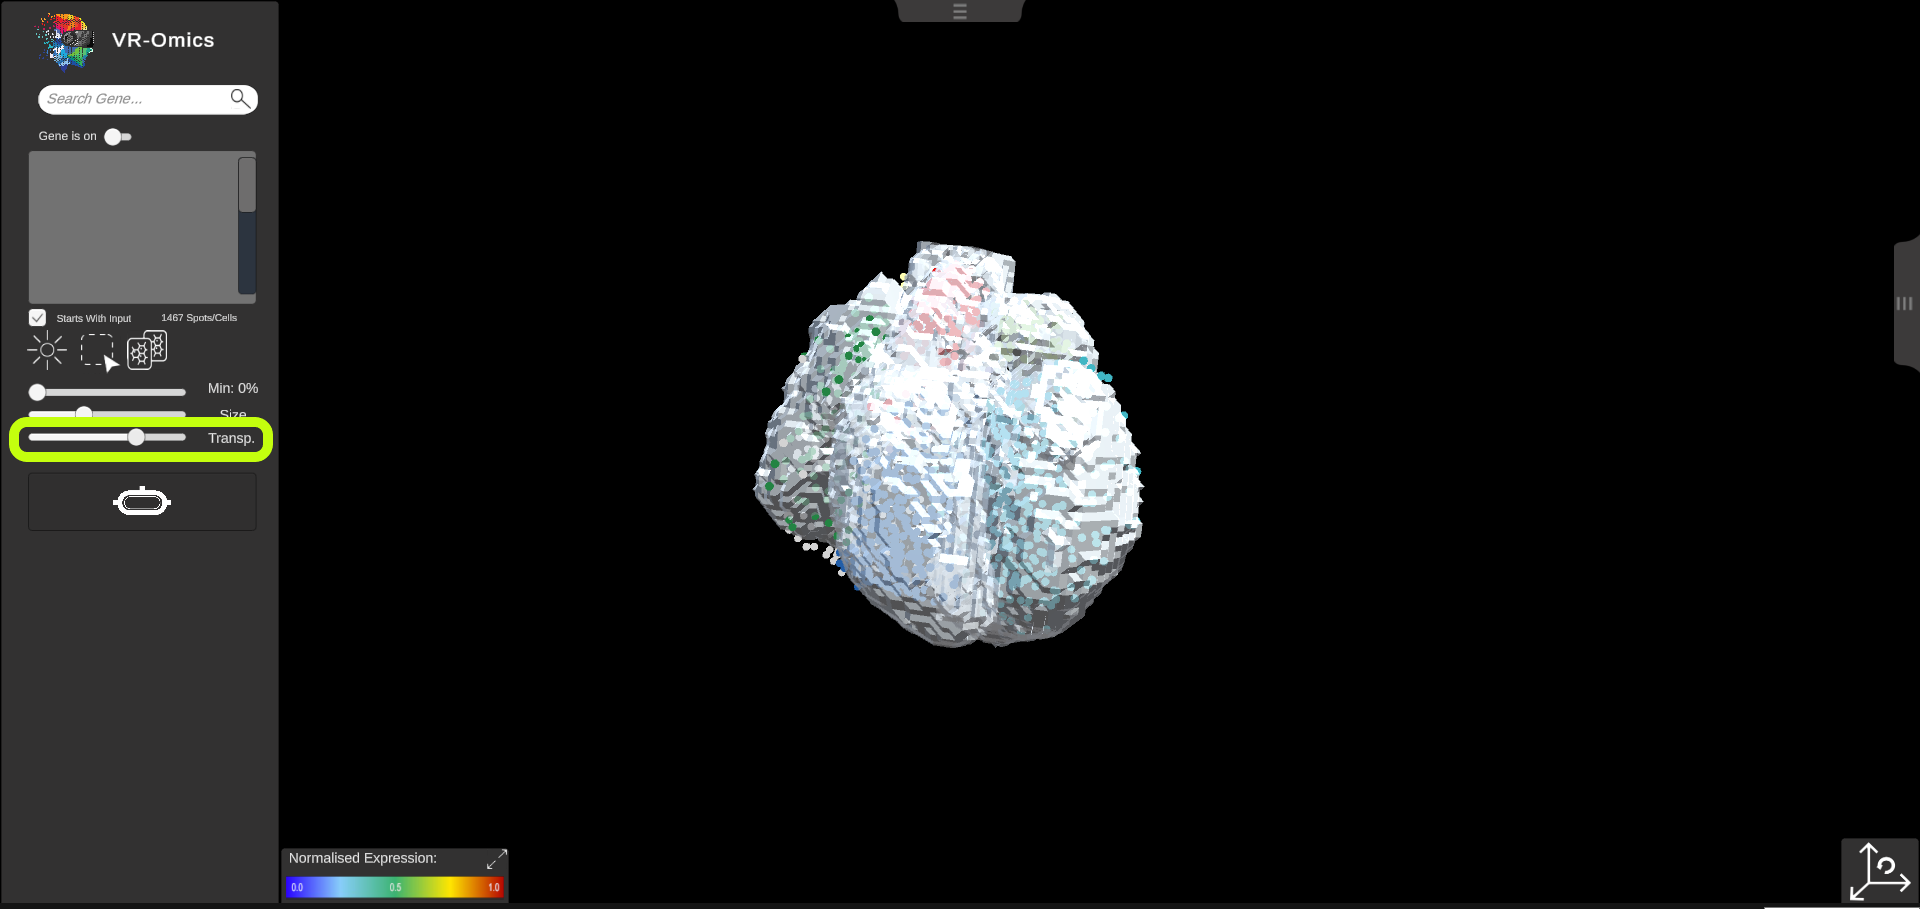
| Change 3D Object Opacity
Visium Xenium STOmics Merfish Tomo-Seq Custom VR Demo |
The opacity of the 3D object can be adjusted:
|
|
|
| Move 3D object
Visium Xenium STOmics Merfish Tomo-Seq Custom VR Demo |
The 3D object can be moved independently from the dataset to align the object:
|
|
|
| Rotate 3D Object
Visium Xenium STOmics Merfish Tomo-Seq Custom VR Demo |
The 3D object can be rotated independently from the dataset to align the object:
|
|
|
| Resize 3D Object
Visium Xenium STOmics Merfish Tomo-Seq Custom VR Demo |
The 3D object can be resized independently from the dataset to align the object:
|
|
|
Customisation
| Feature | Description | Icon | Image |
|---|---|---|---|
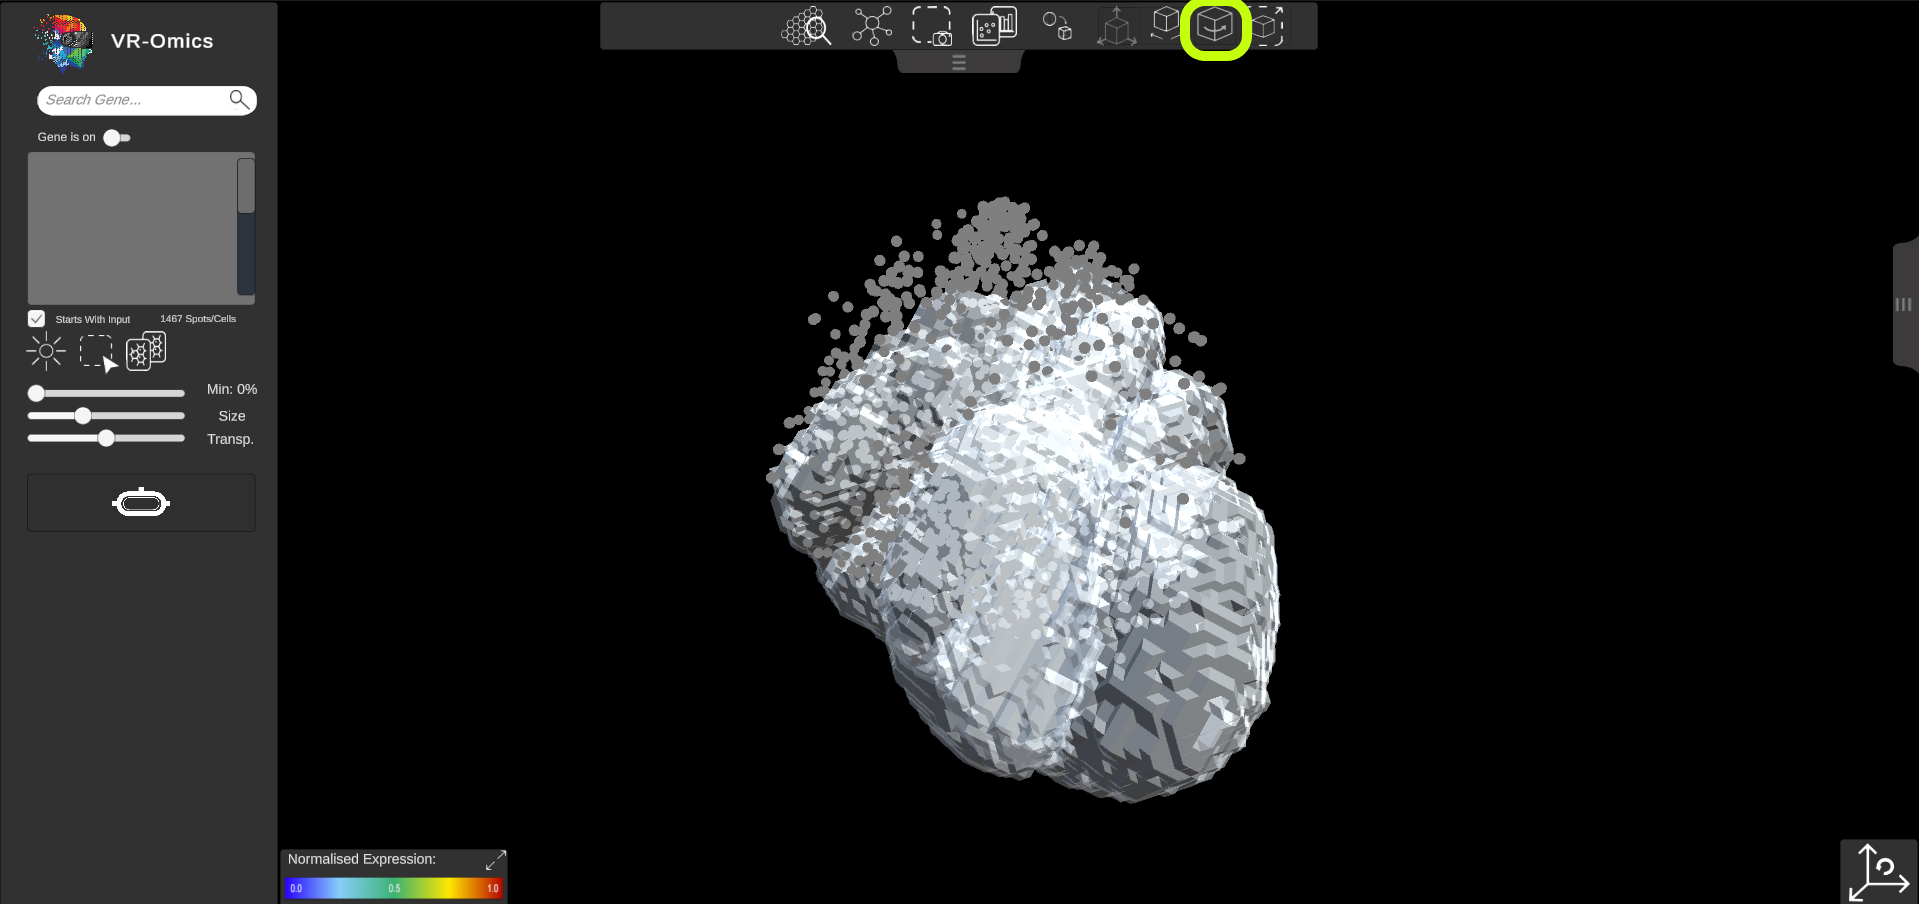
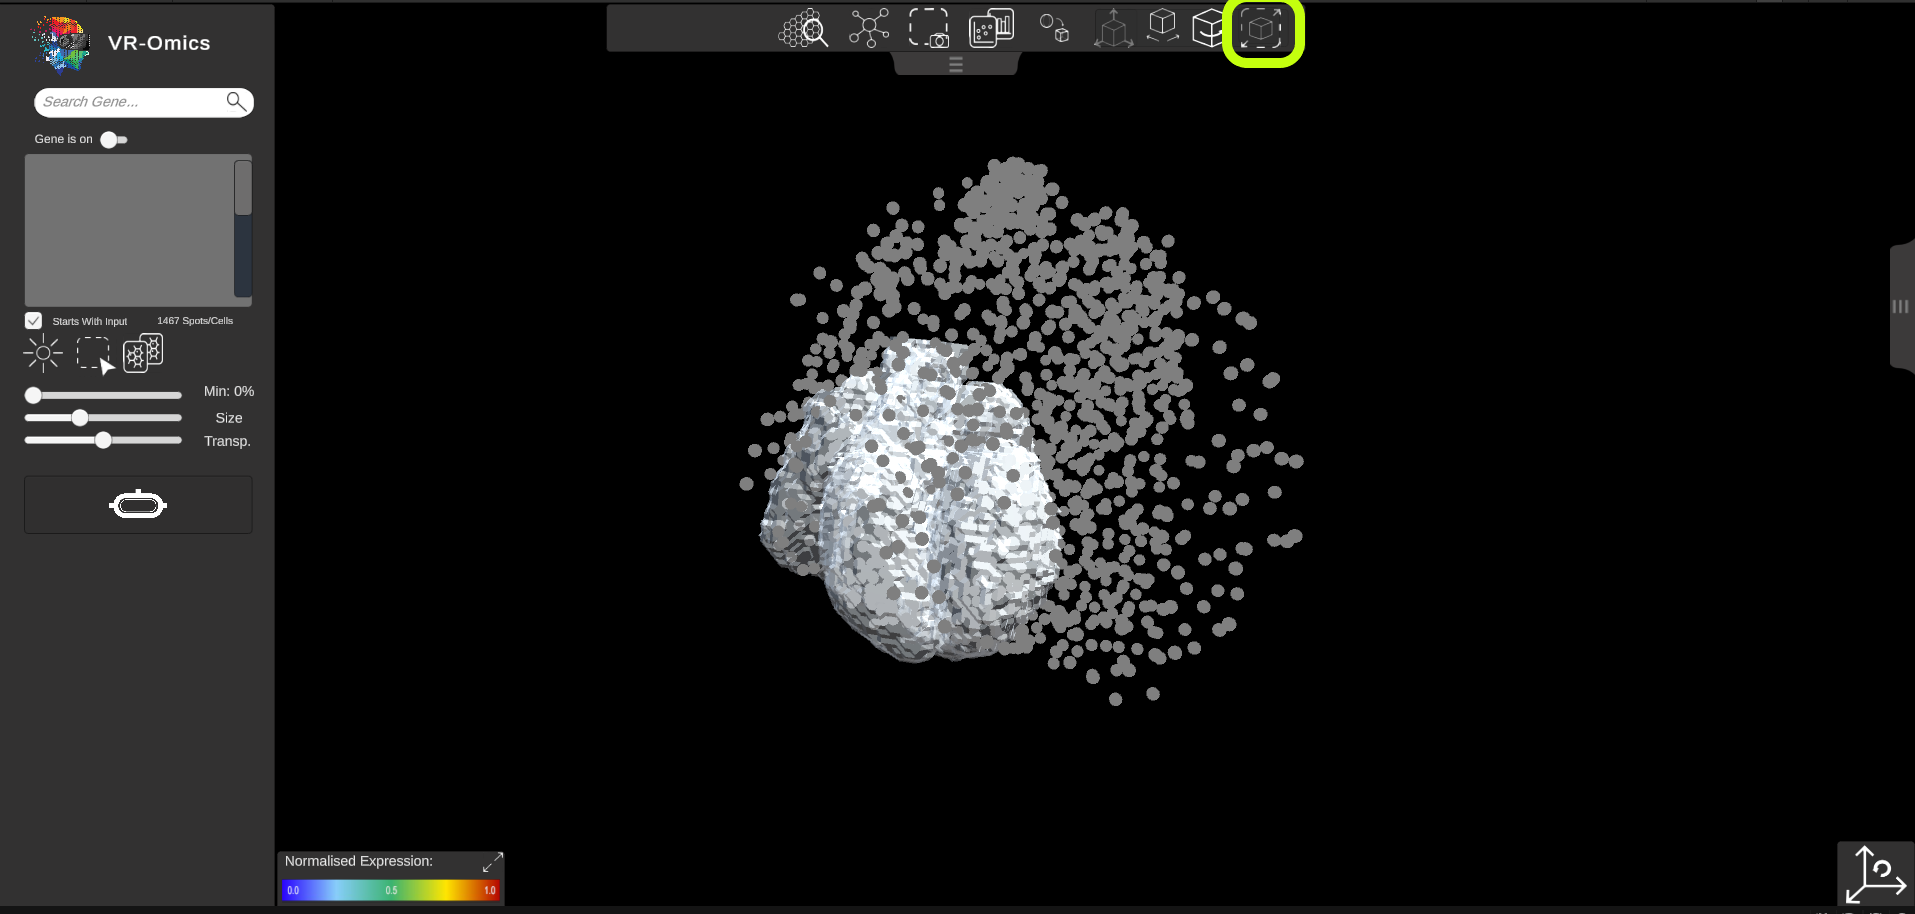
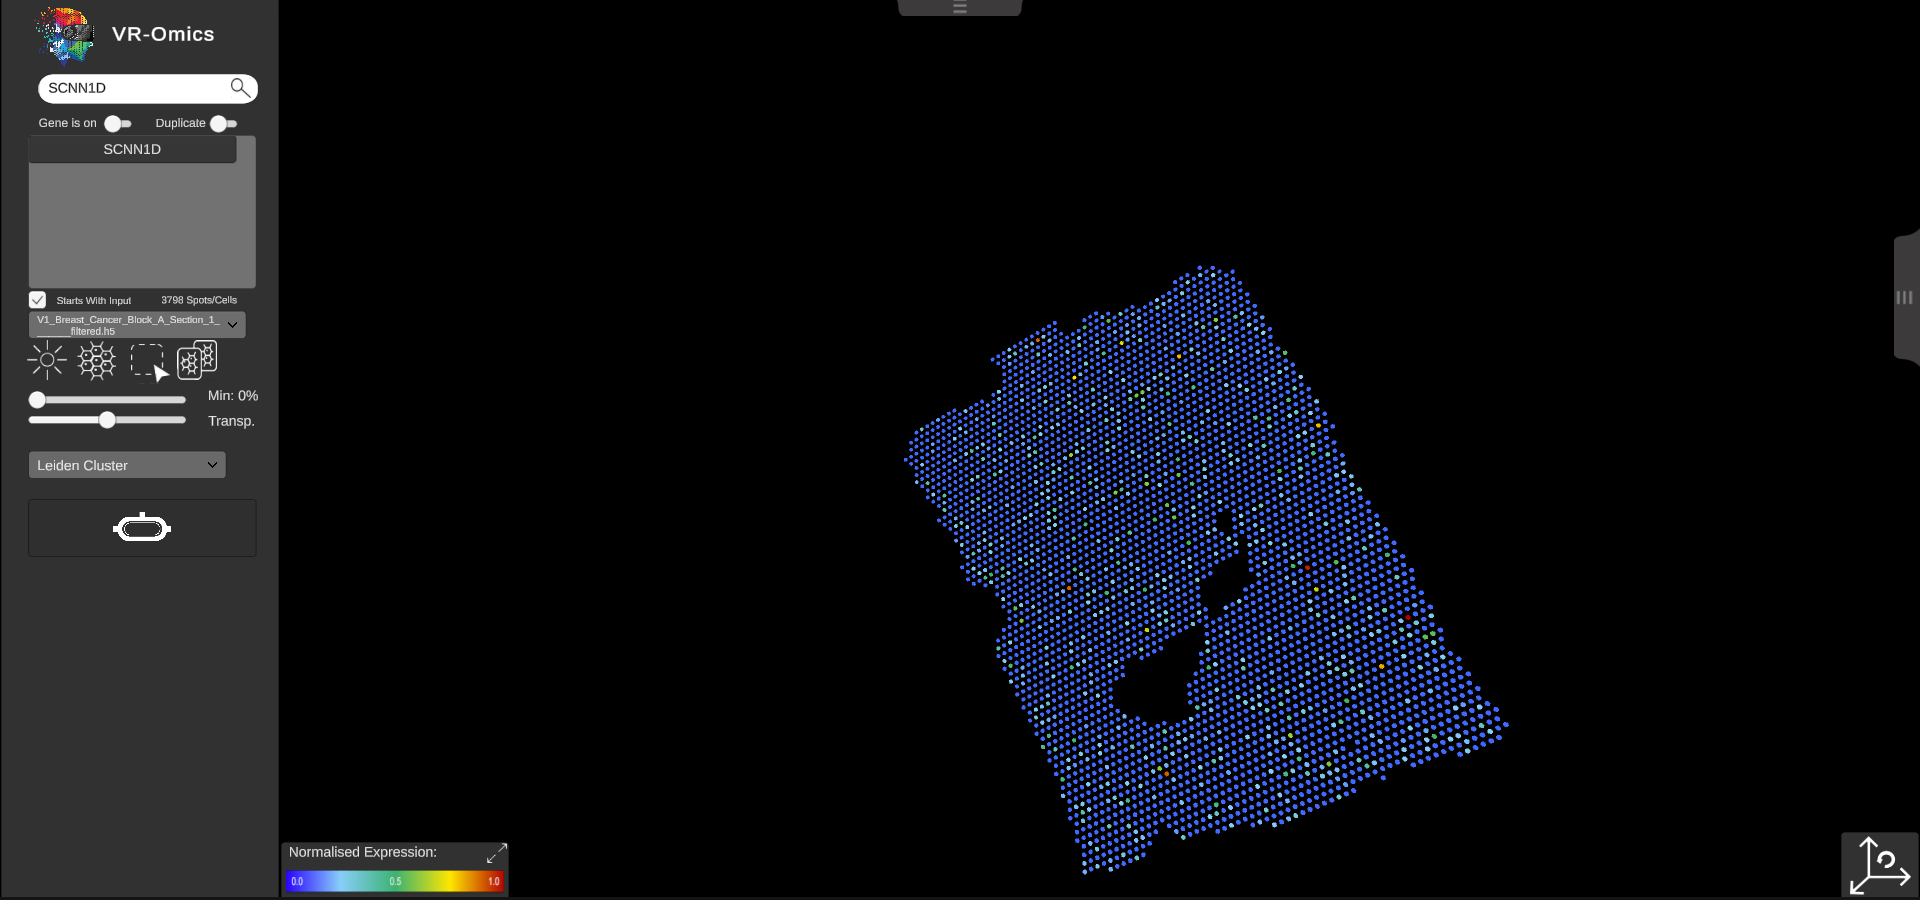
| Change the Symbol
Visium Xenium STOmics Merfish Tomo-Seq Custom VR Demo |
Per default the Symbol to visualise a location is a sphere (except of Tomo-Seq). This can be changed to a Cube:
|
|
|
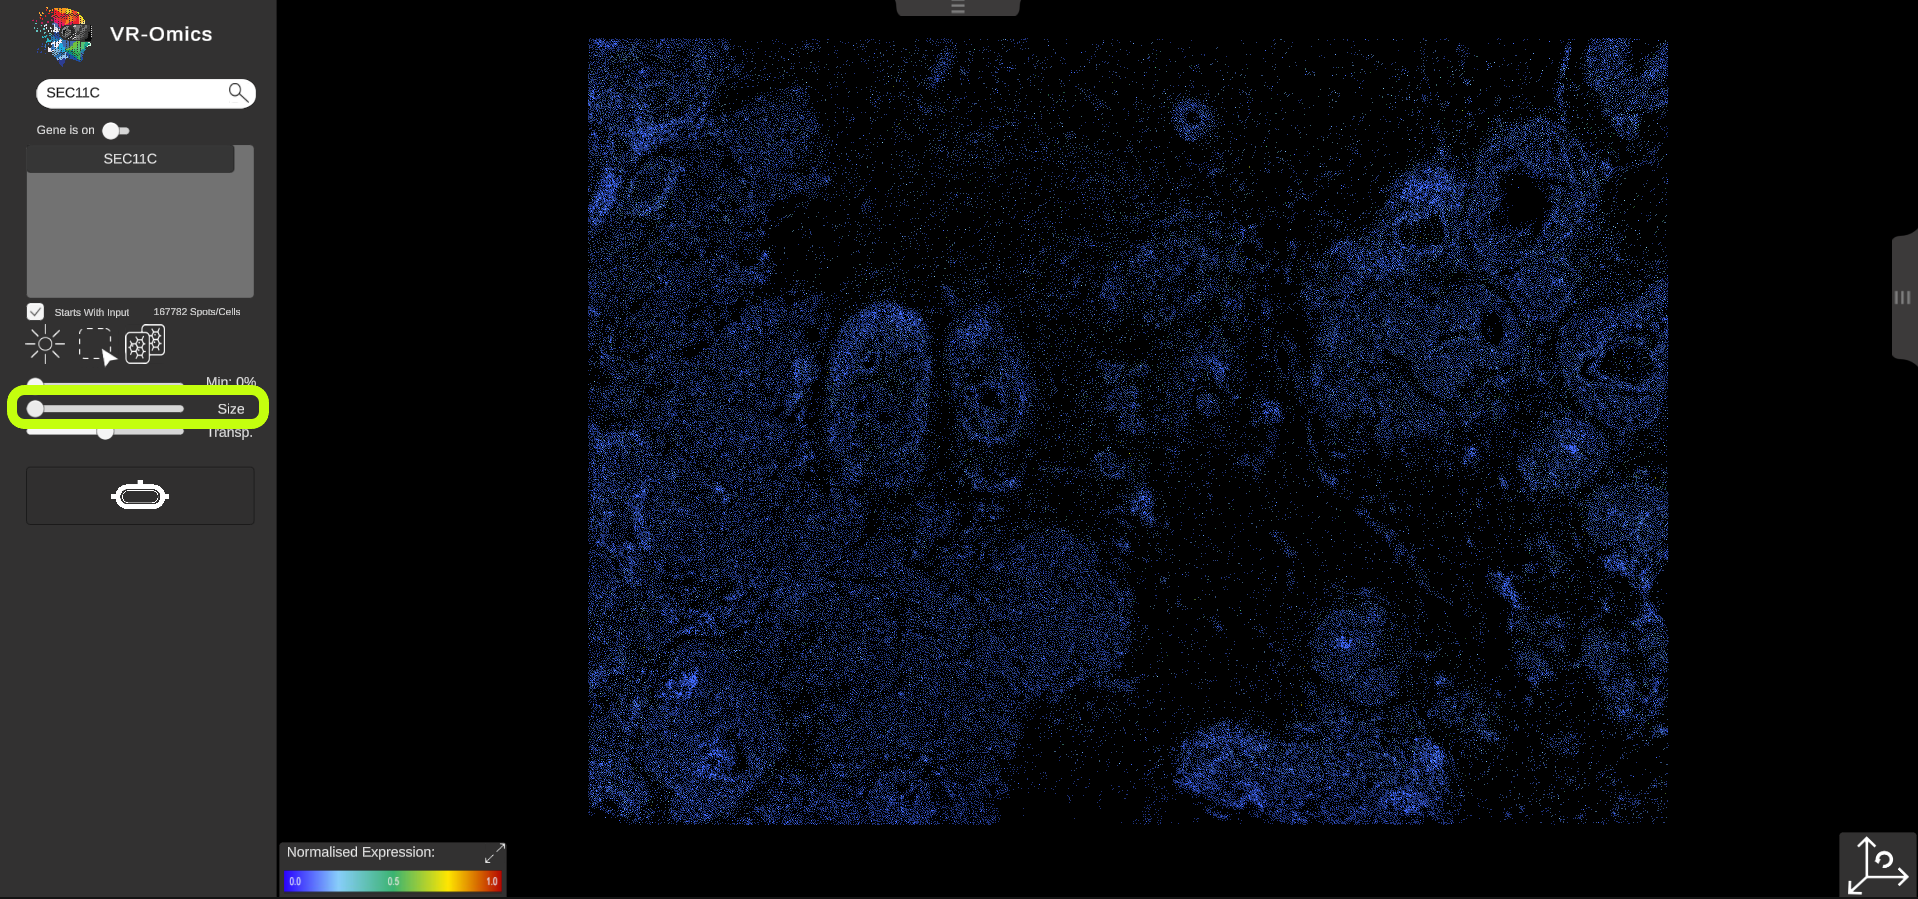
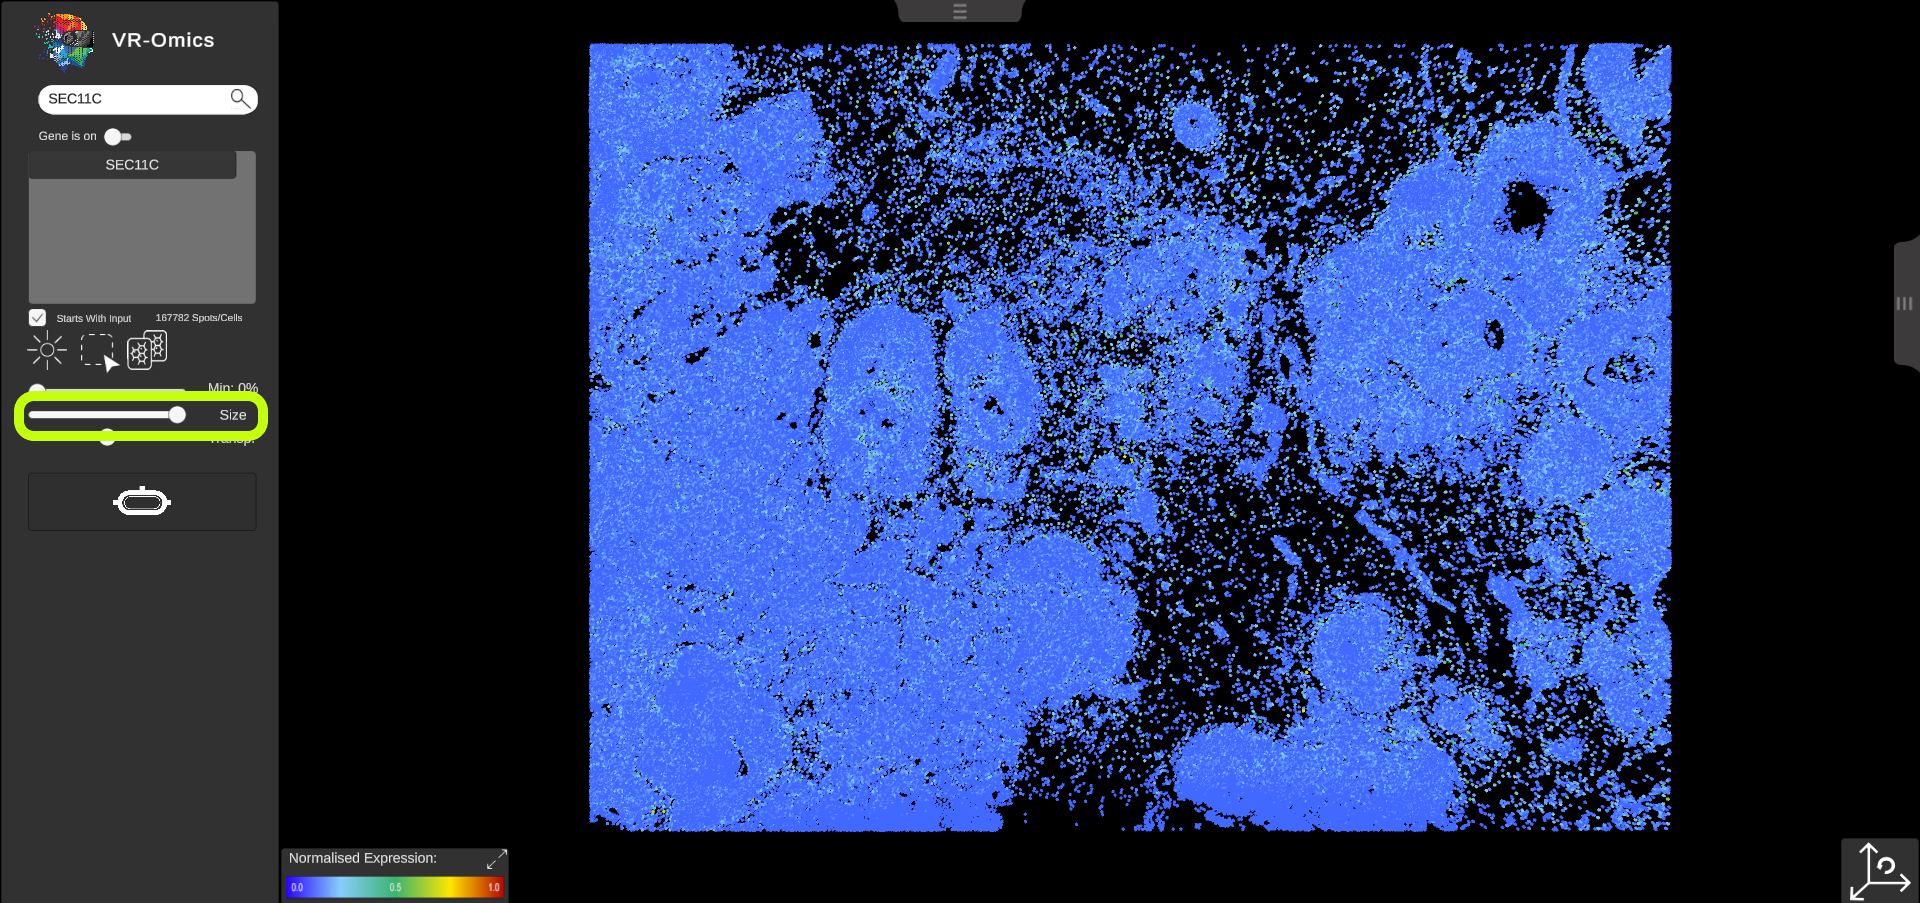
| Change the Symbol Size
Visium Xenium STOmics Merfish Tomo-Seq Custom VR Demo |
The symbol size can be changed:
This feature is disabled for some technologies like Visium since resizing the spots would distort the visualisation of the data.
|
Size
|
|
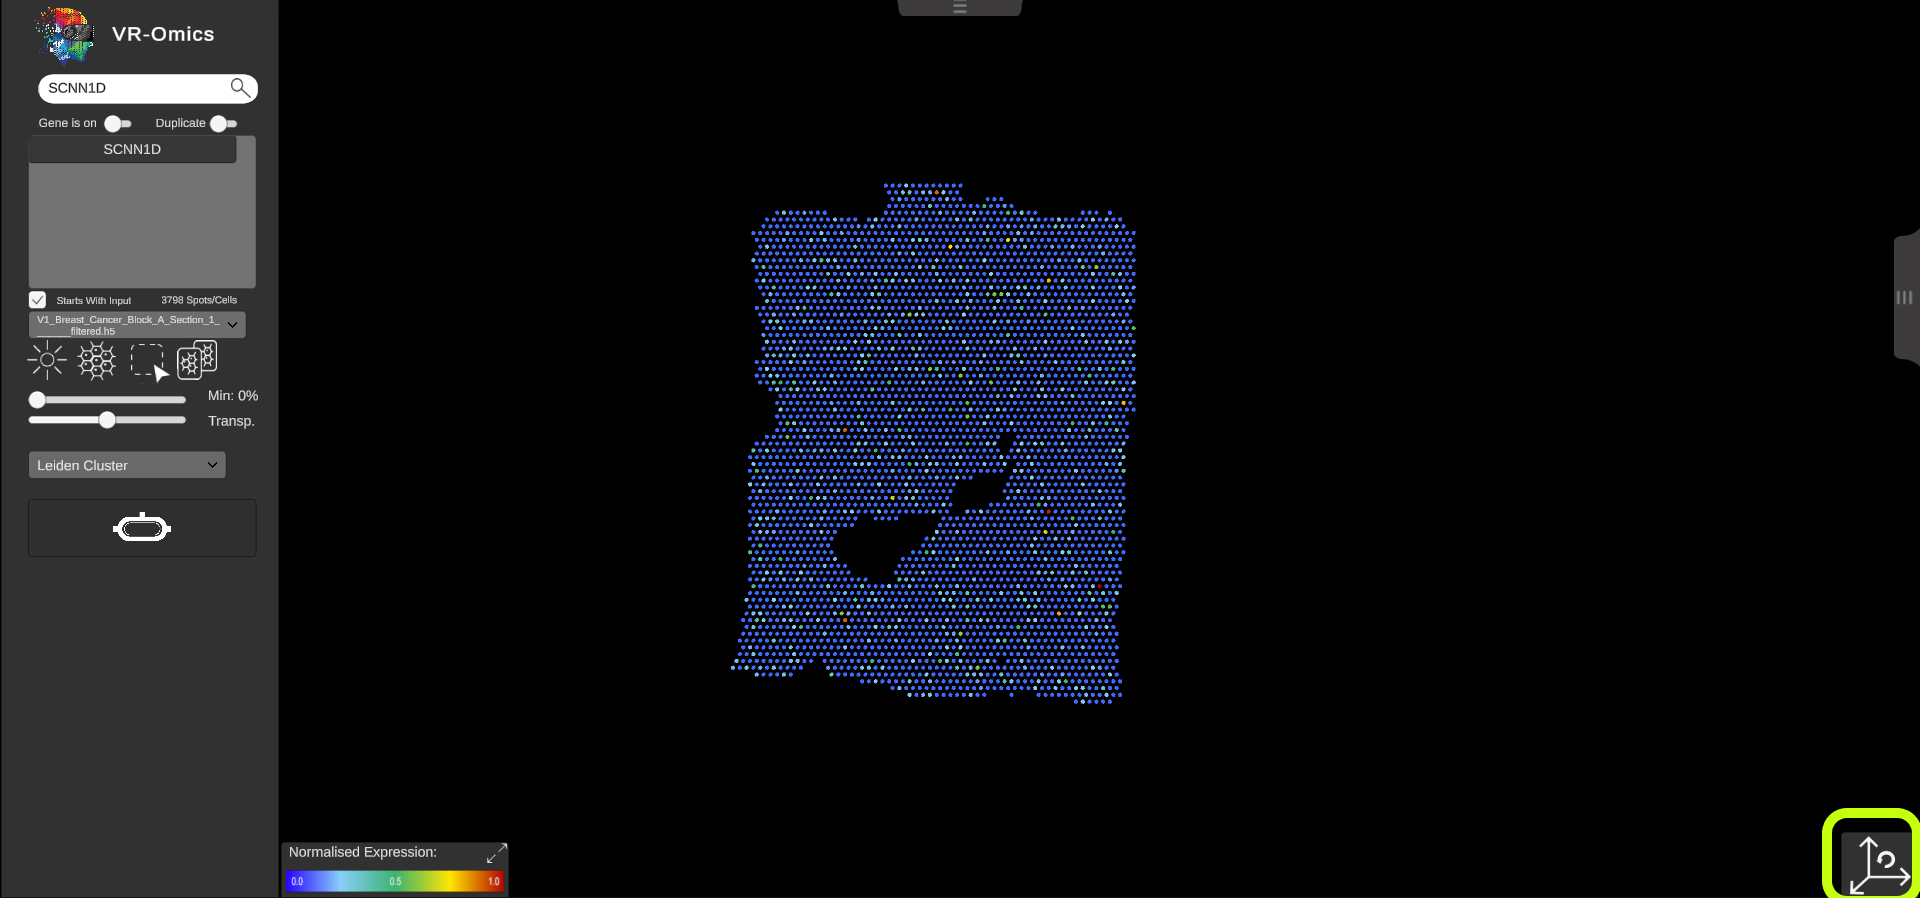
| Reset the view
Visium Xenium STOmics Merfish Tomo-Seq Custom VR Demo |
To reset the view to the origin click the reset view button in the bottom left of the screen. |
|
|
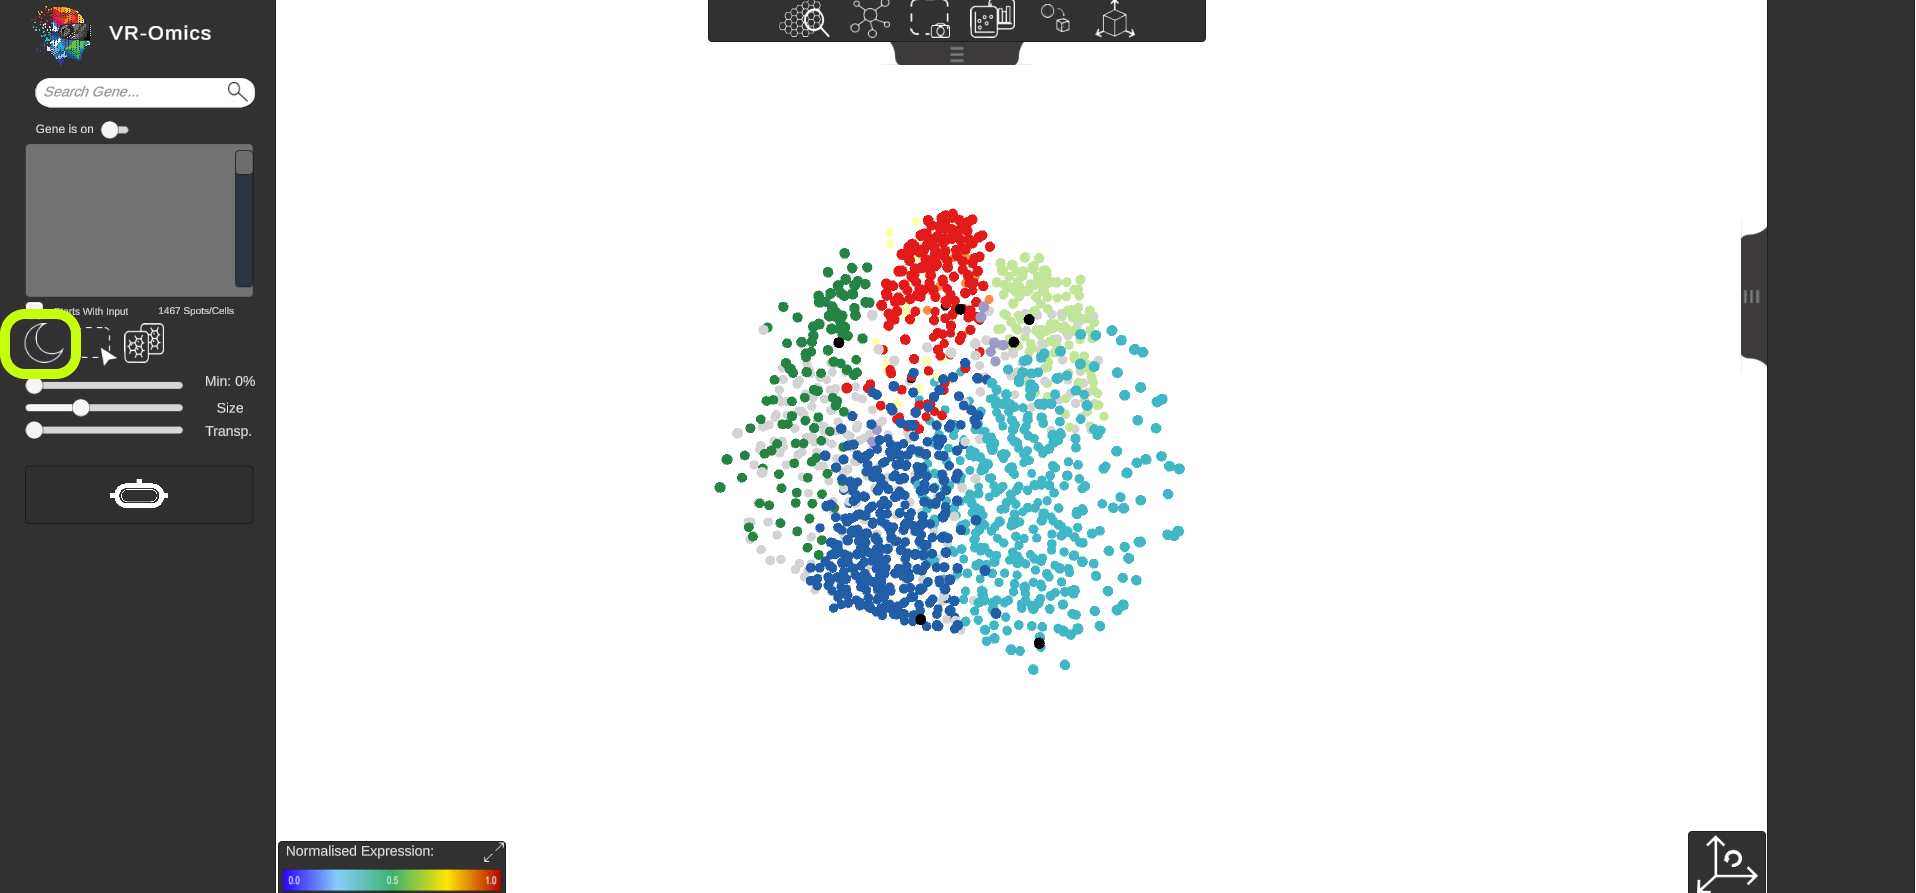
| Change Background Colour
Visium Xenium STOmics Merfish Tomo-Seq Custom VR Demo |
The background colour can be changed from dark to bright mode.
|
|
|
Address
Murdoch Children's Research Institute, Parkville, Melbourne
denis.bienroth@mcri.edu.au